Trade Pullbacks with Clear Structure Instead of Guesswork
The Iron Oak Trading Package combines trend identification, pullback zone mapping, and liquidity-based confirmation to help traders identify both shallow and deep pullback opportunities with greater clarity.
Why Pullbacks are harder to trade than they look?
Trend pullback trading is something most traders are familiar with.
The idea sounds simple: when the market is trending, wait for a pullback and enter in the direction of the trend.
In real trading, however, it rarely works that cleanly.
Sometimes price touches a level briefly and then continues moving in the direction of the trend. You wait for a deeper retracement to get a better entry… but it never comes.
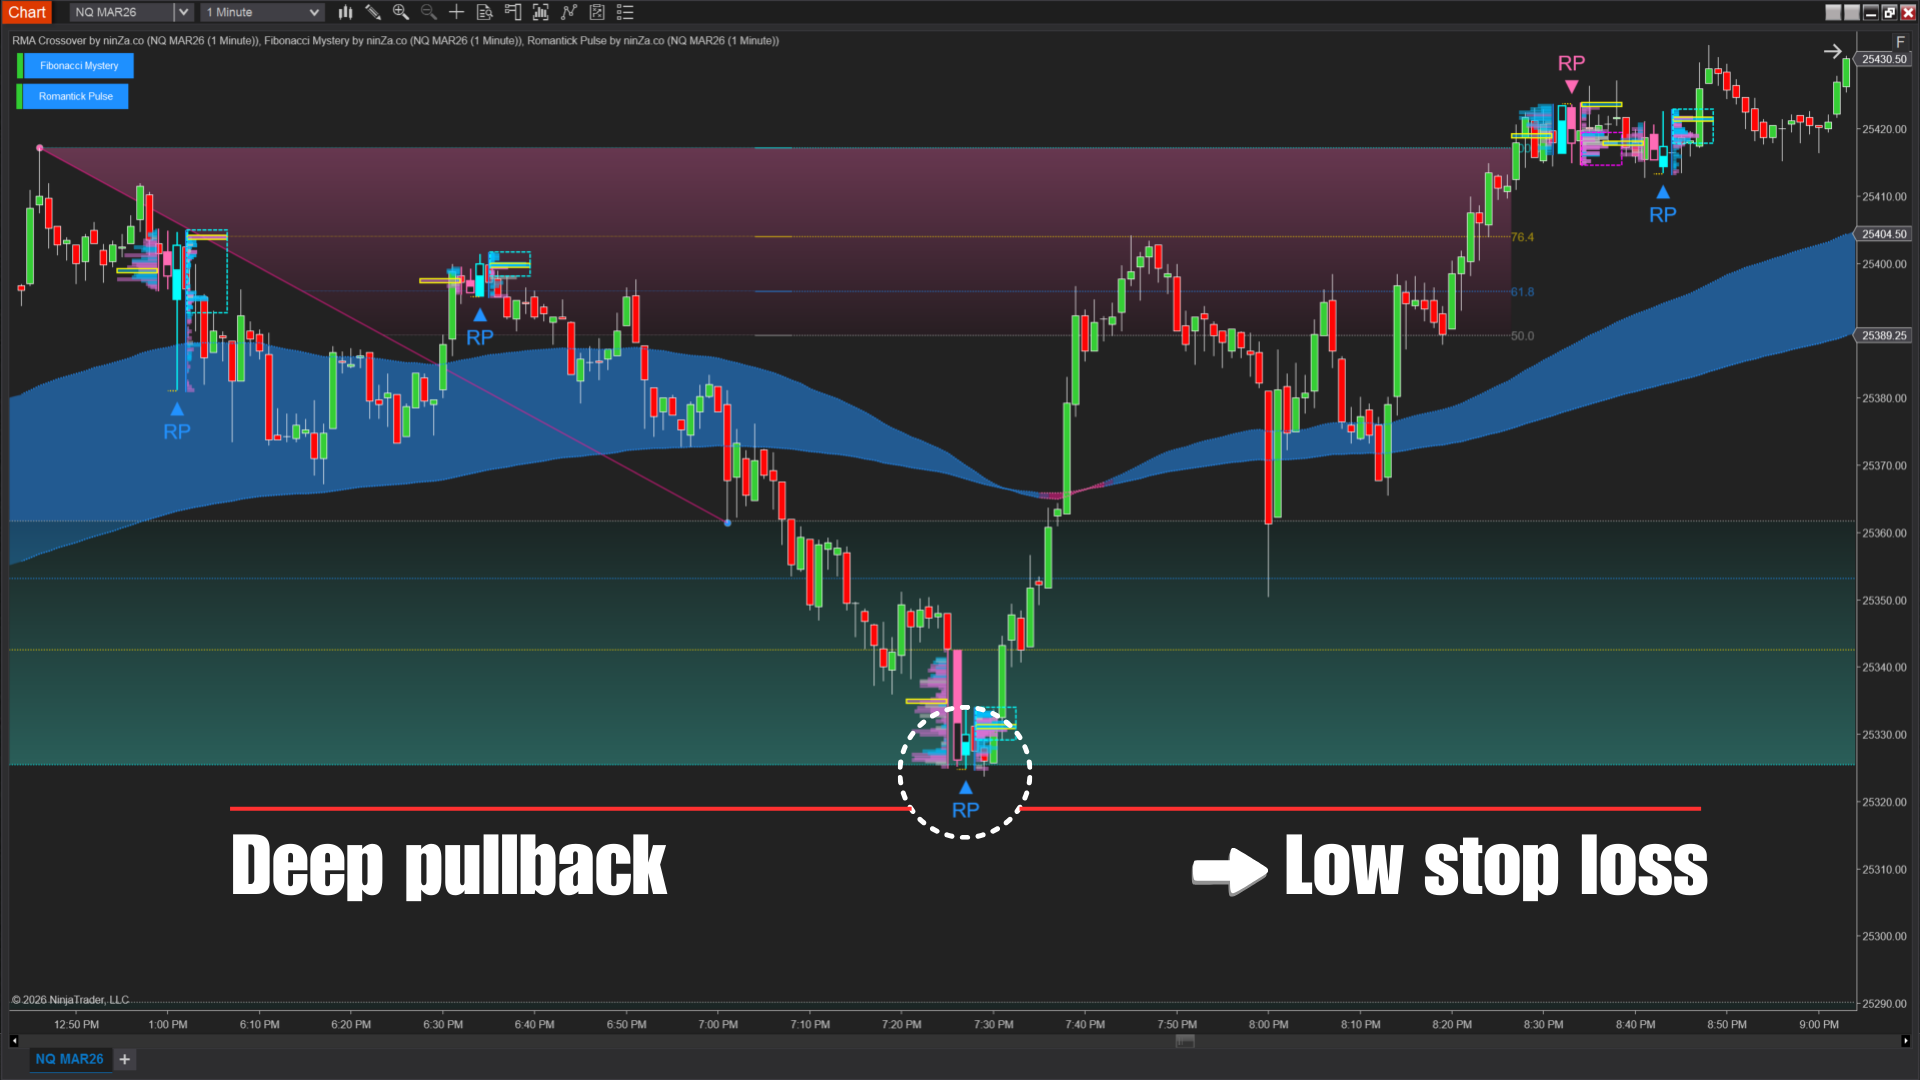
Sometimes the pullback extends deeper than expected. What initially looks like a normal retracement turns into a larger correction that stops you out before the market resumes the original trend.
This happens because market momentum constantly changes.
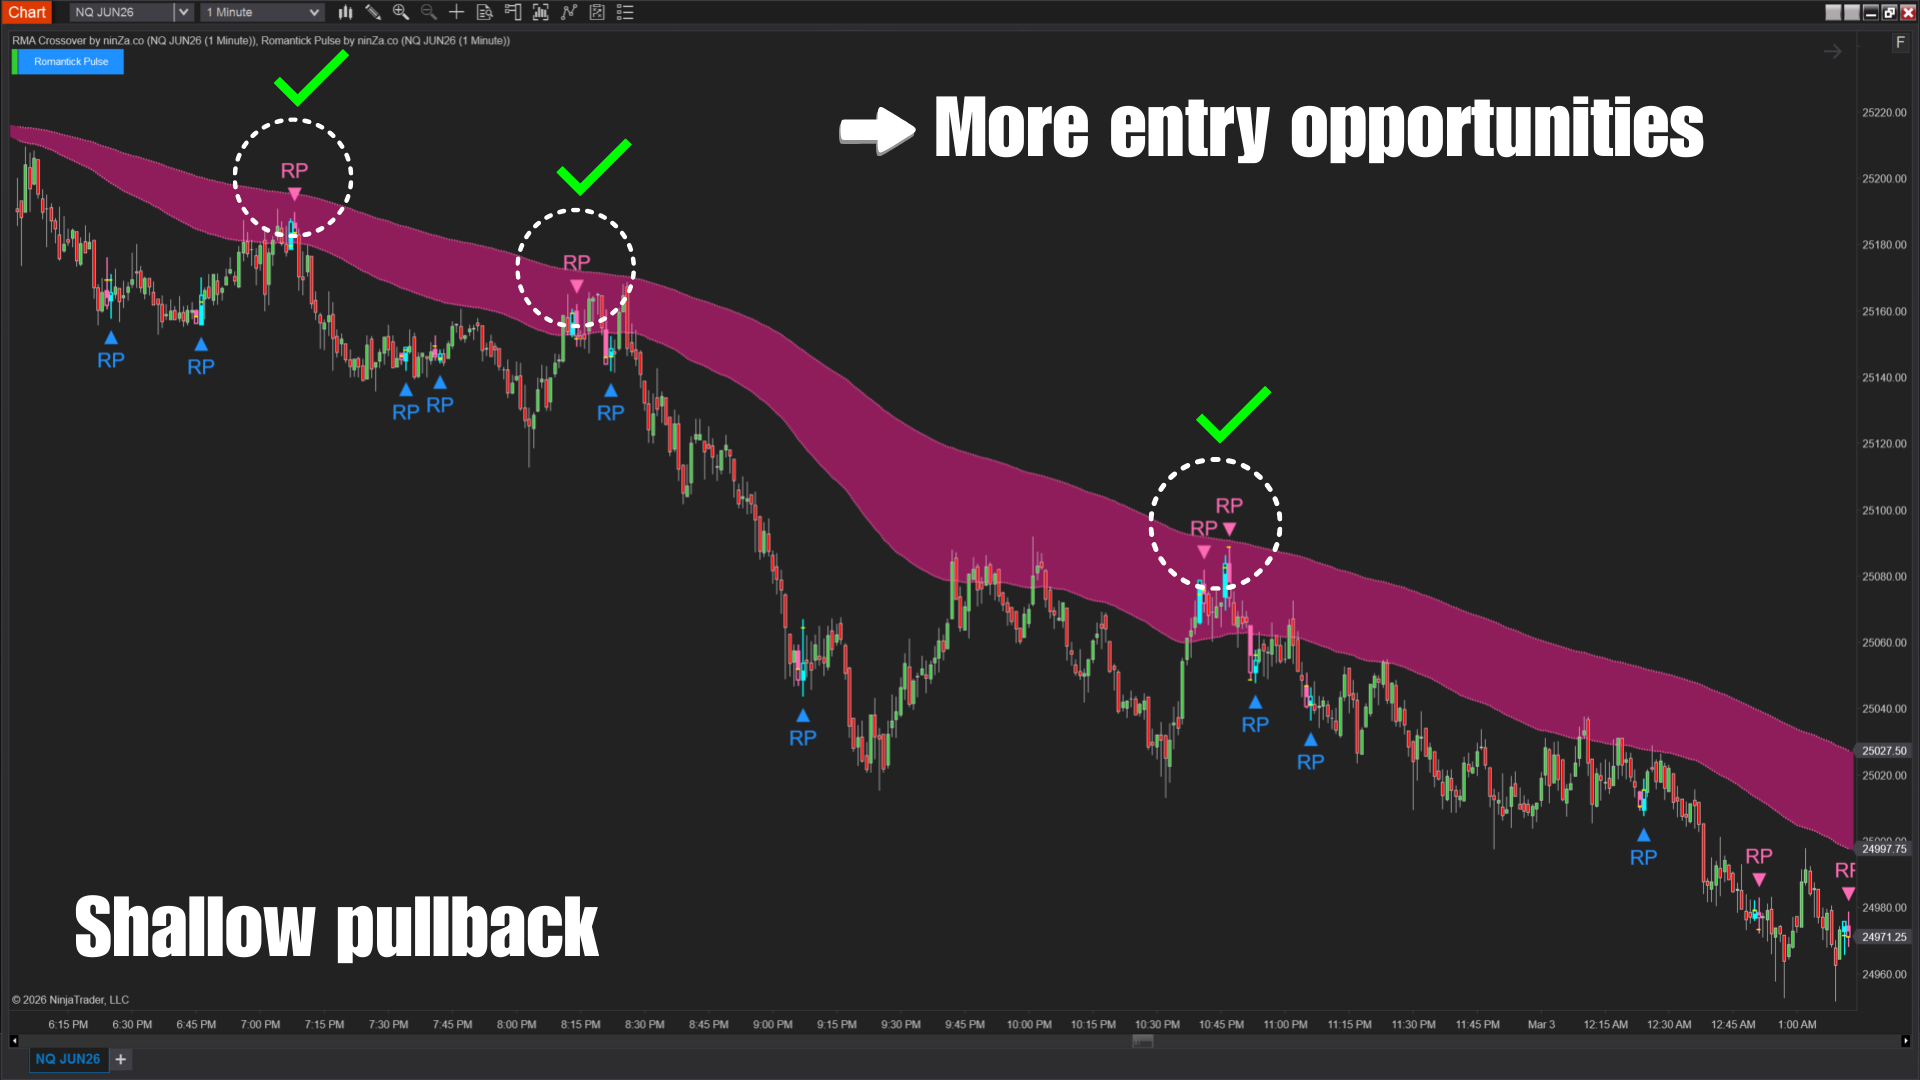
When momentum is strong, pullbacks tend to stay shallow.
When momentum slows, the market often retraces deeper before continuing the trend.
The challenge is that many traders do not have a clear way to distinguish between these 2 situations. As a result, entries often end up poorly aligned with the actual momentum of the market.
Introducing Iron Oak Trading Package: A smarter way to time Pullback entries
The Iron Oak Trading Package approaches pullback trading with a simple idea:
Not all pullbacks behave the same.
Some remain shallow during strong momentum, while others retrace much deeper before the trend resumes.
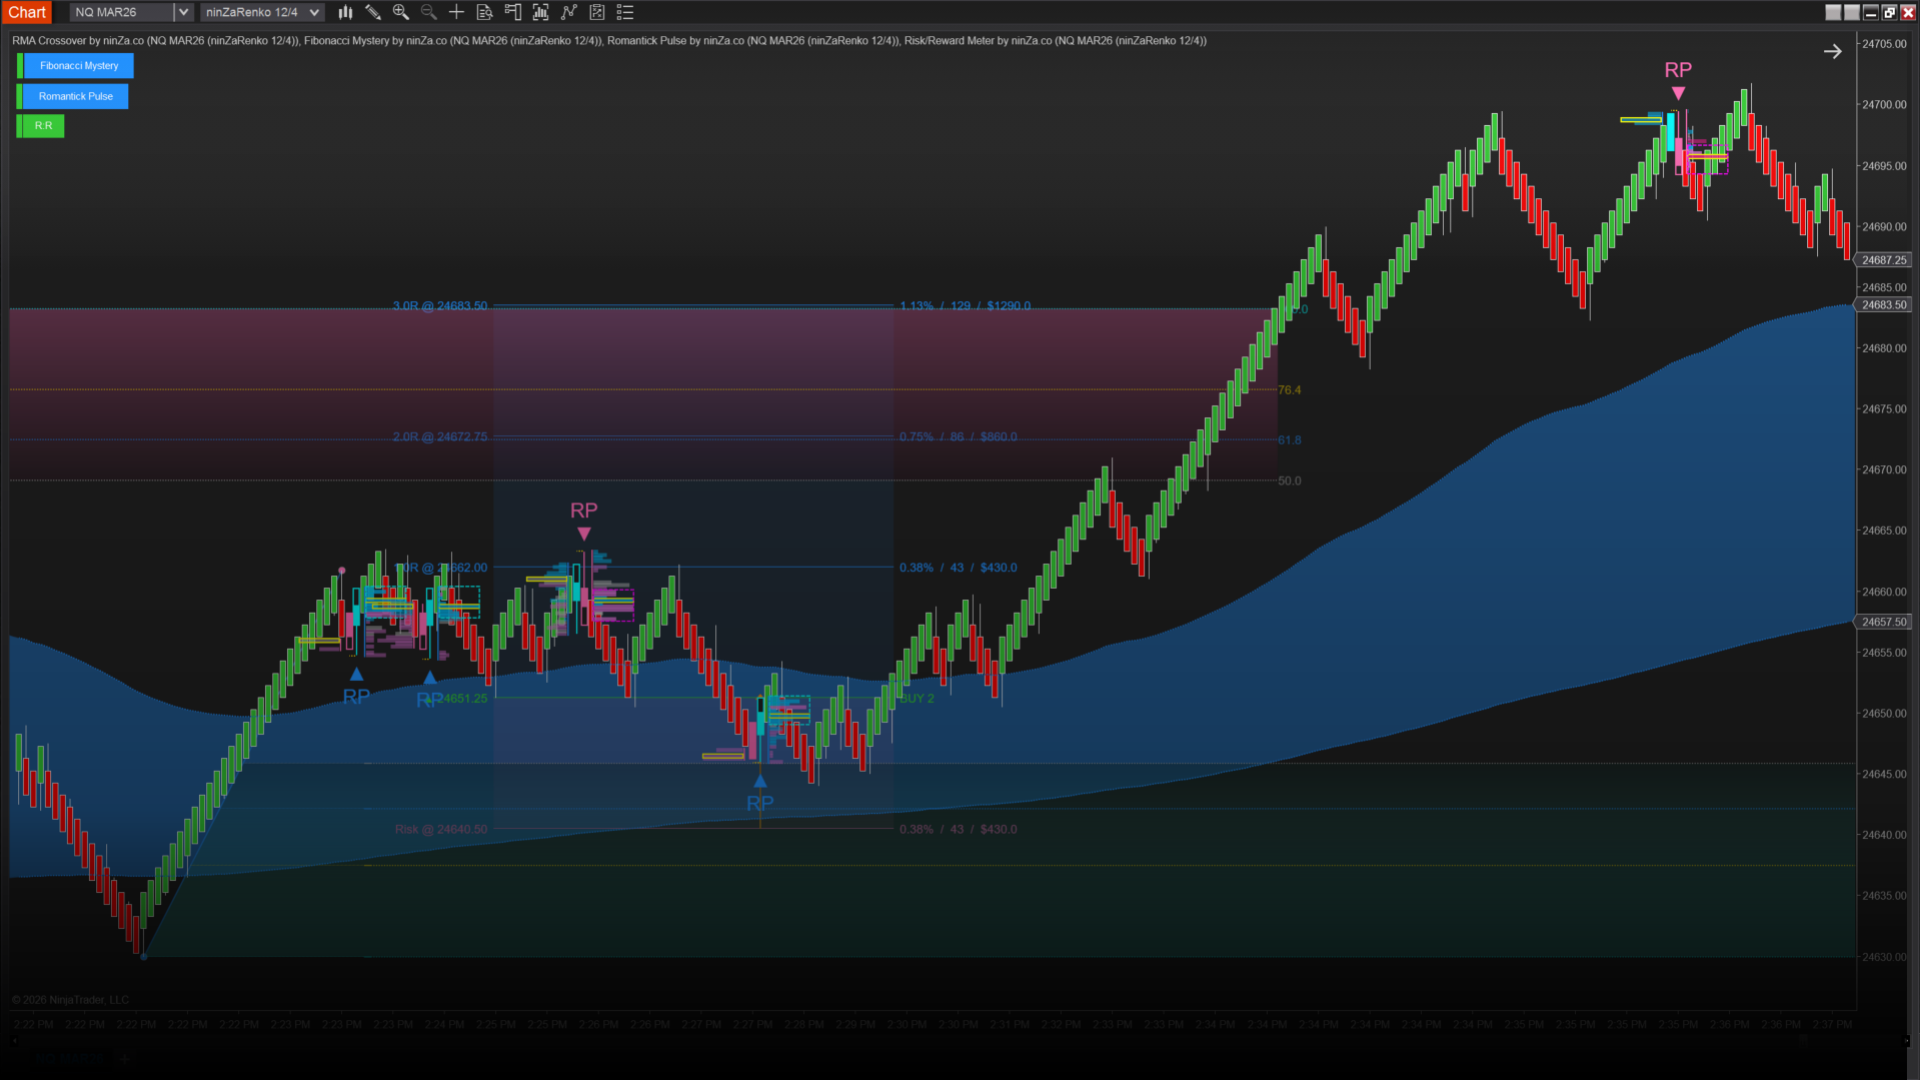
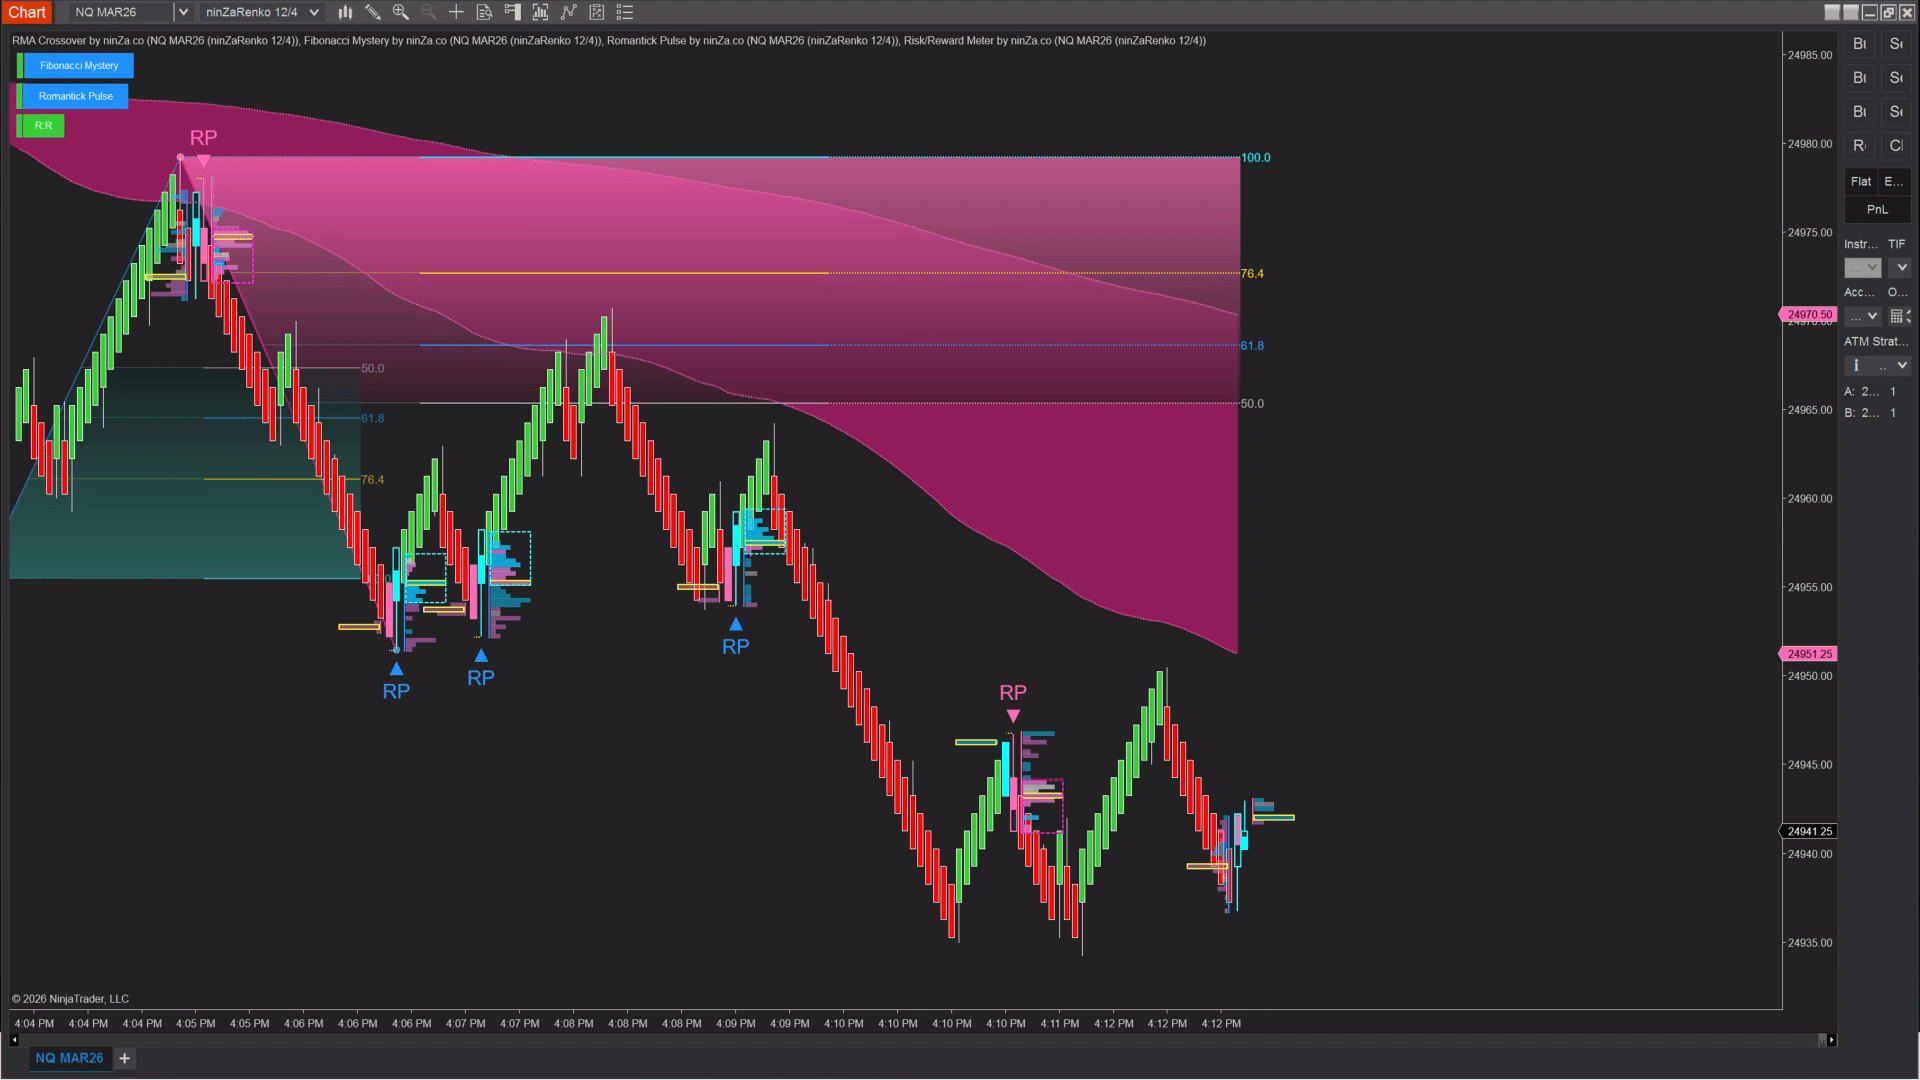
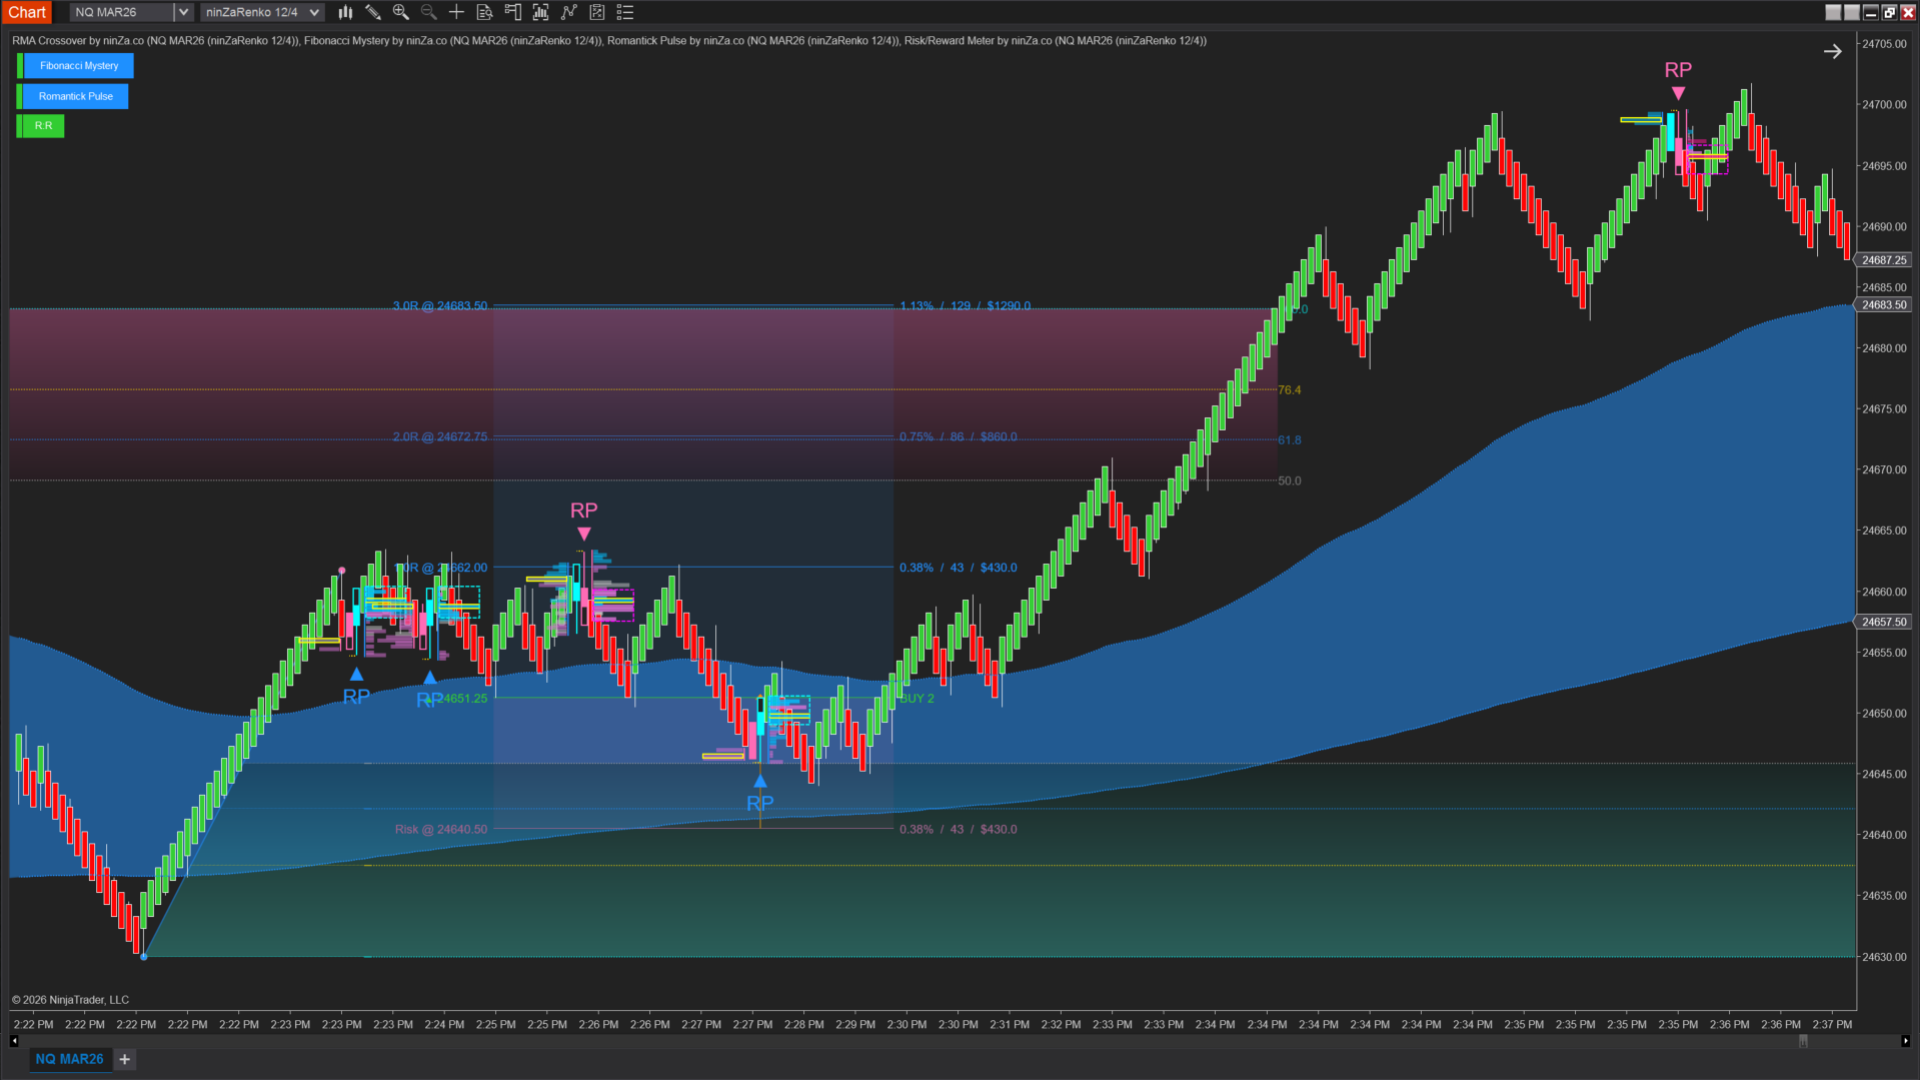
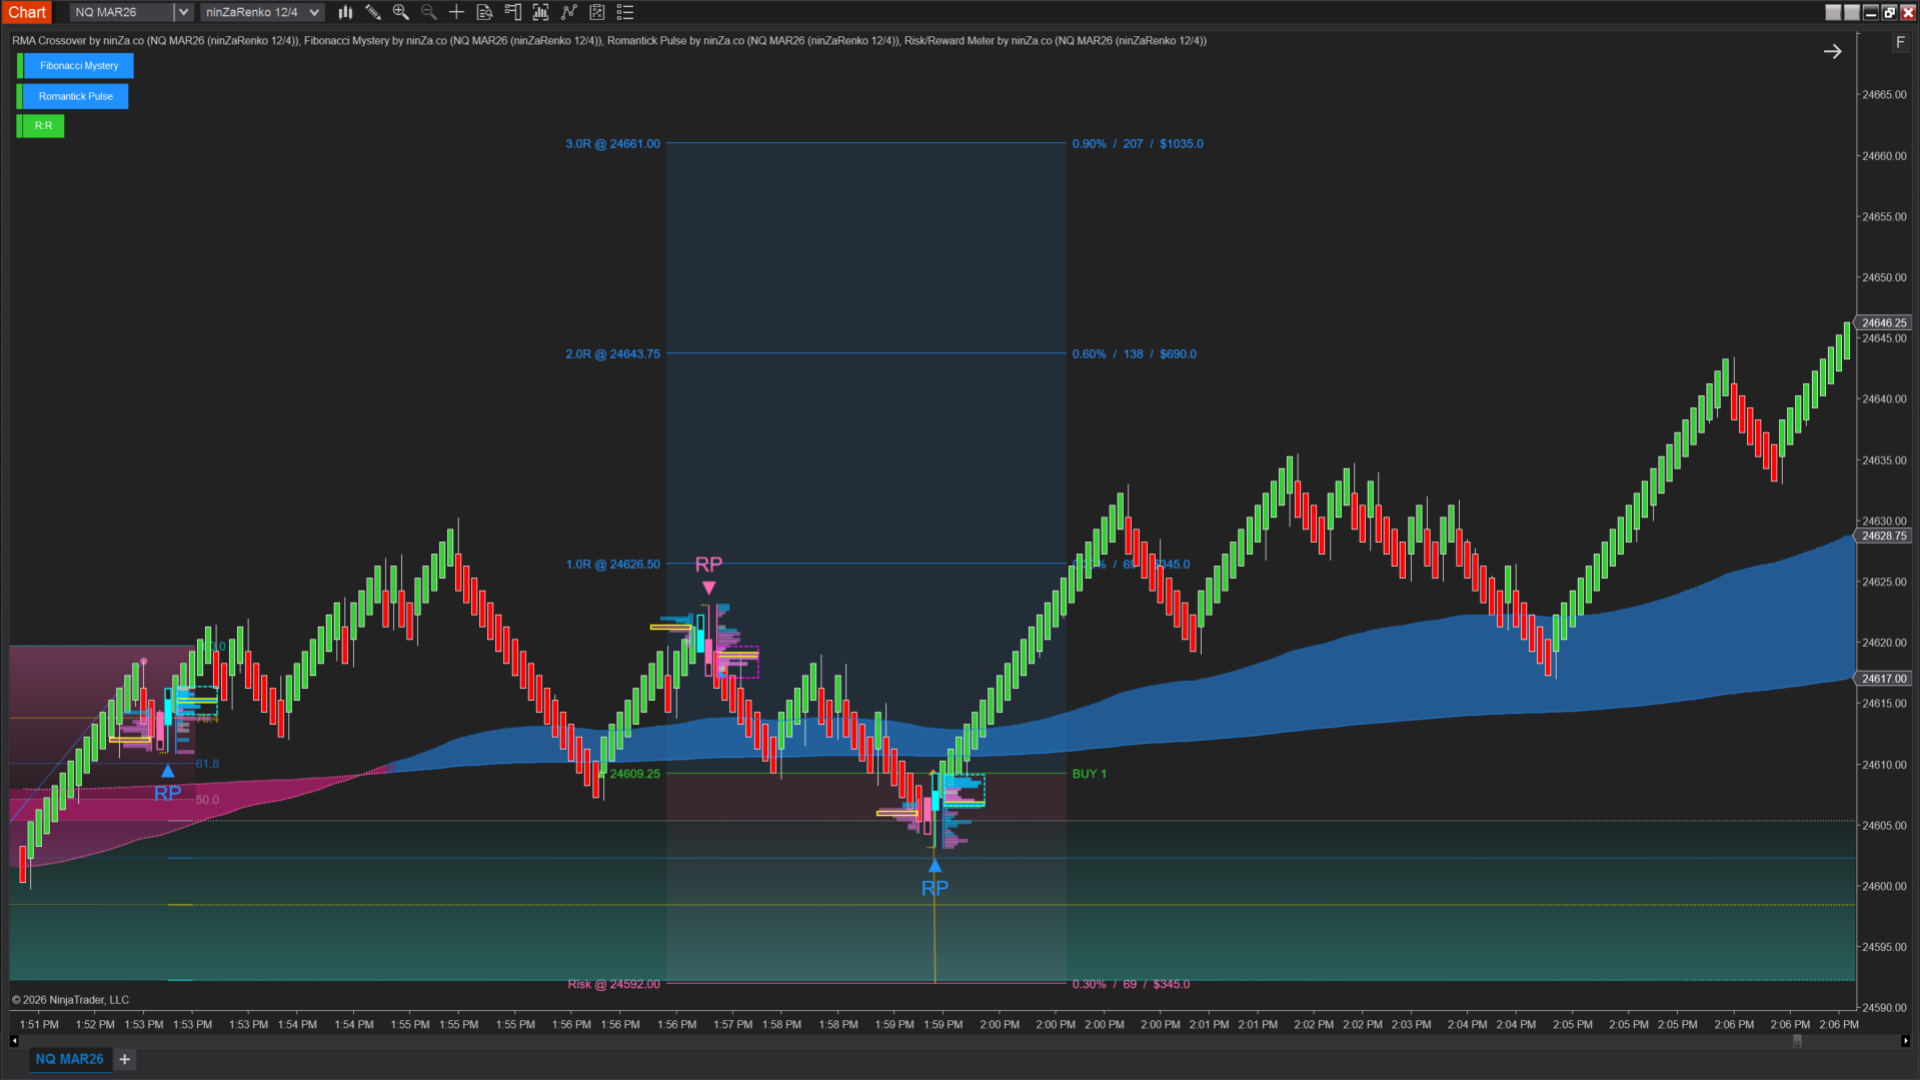
To handle both situations, the strategy uses a dual-zone pullback approach designed to capture both shallow pullbacks & deeper corrections.
The system follows the UTF framework, which focuses on 3 essential elements of the market: Trend – Zone – Signal


Step 1: Identify the trend
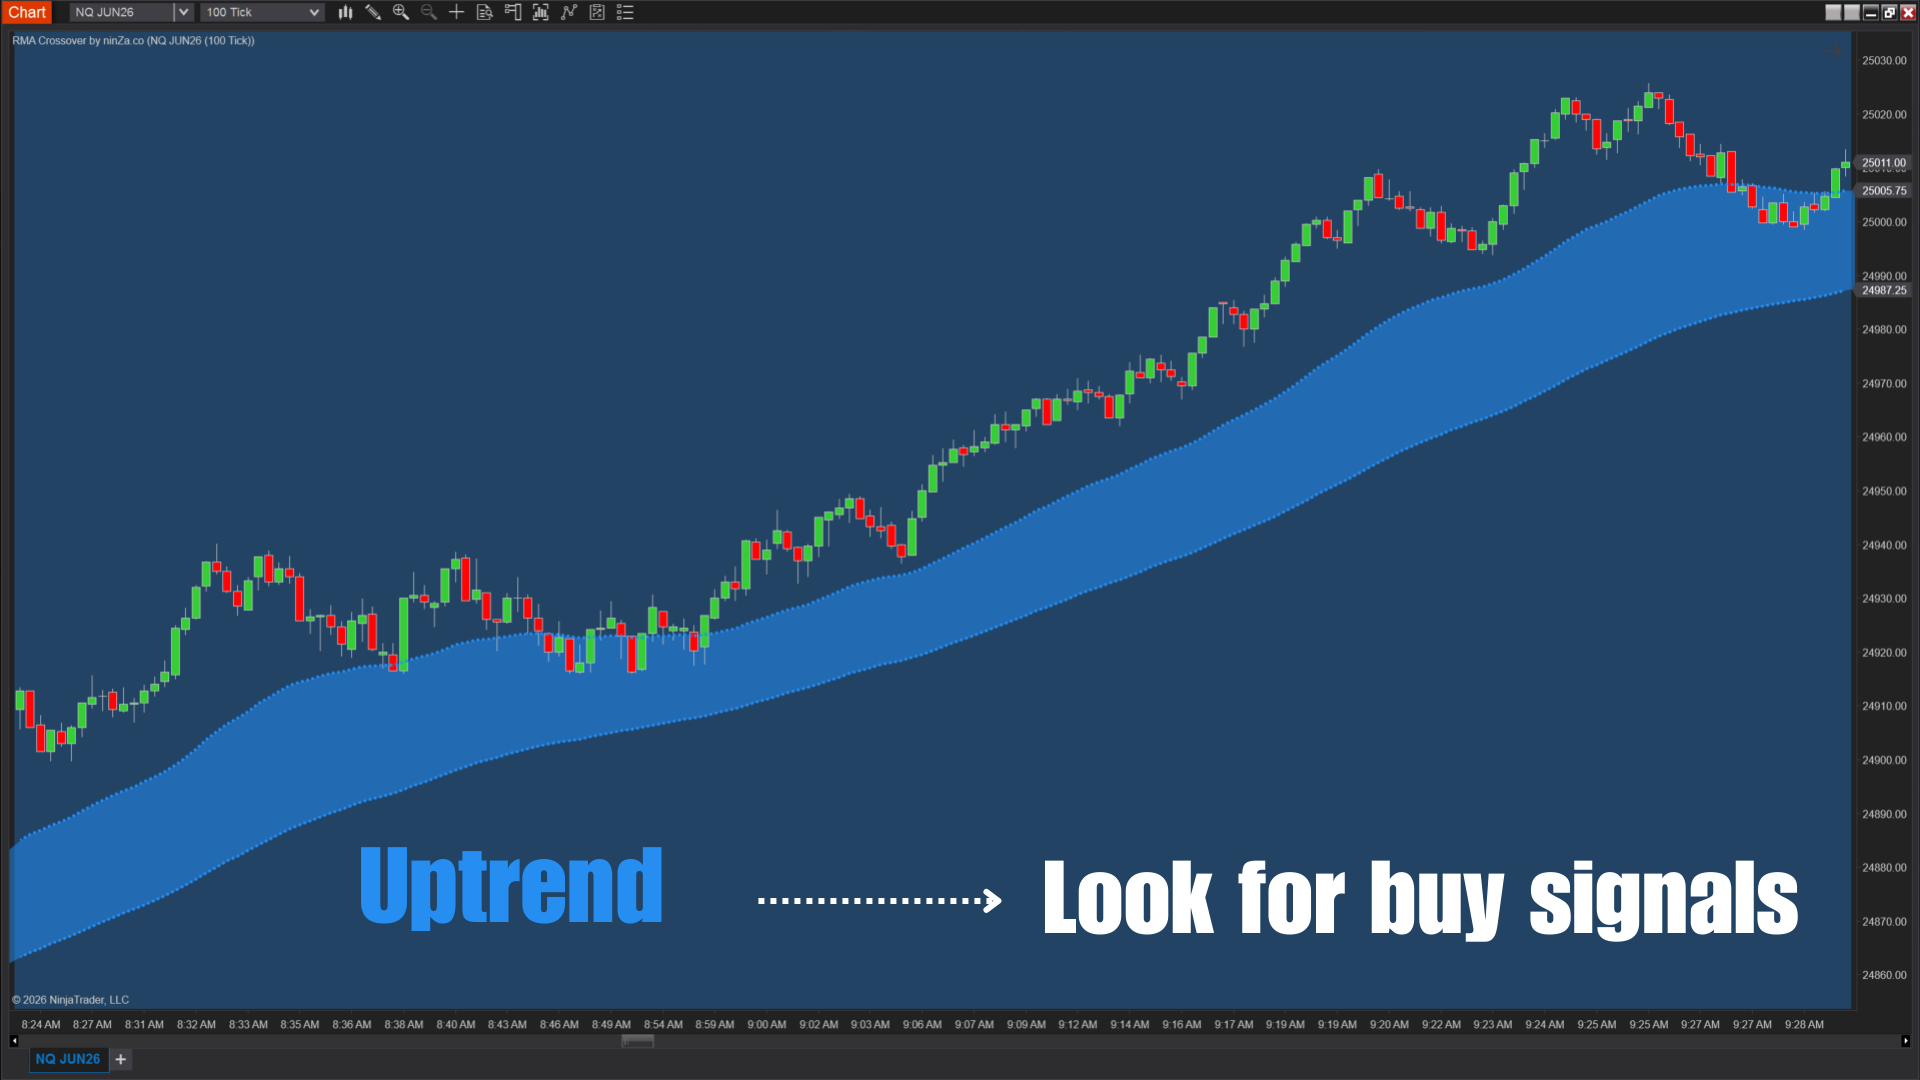
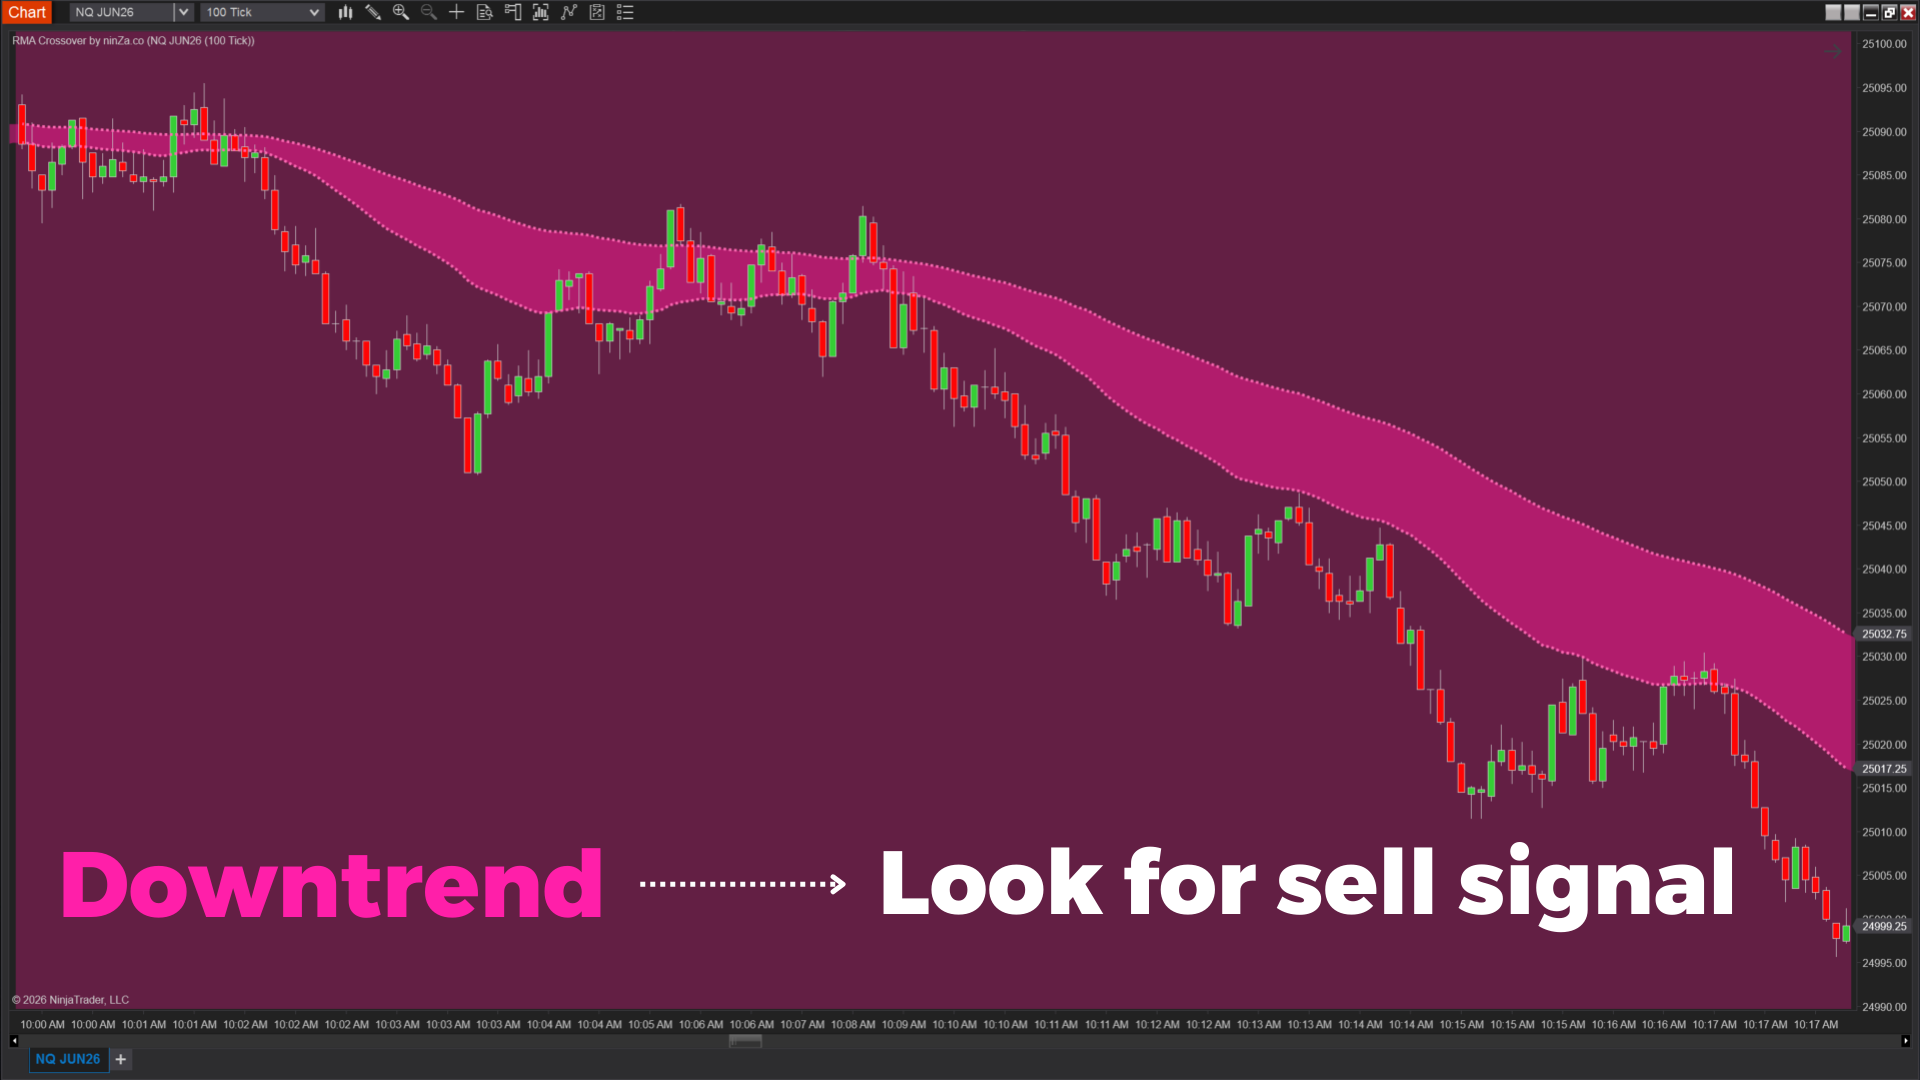
The RMA Crossover indicator defines the dominant market trend.
By focusing on the broader direction of the market, traders can avoid taking pullback trades that go against the underlying trend.


Step 2: Locate pullback zones
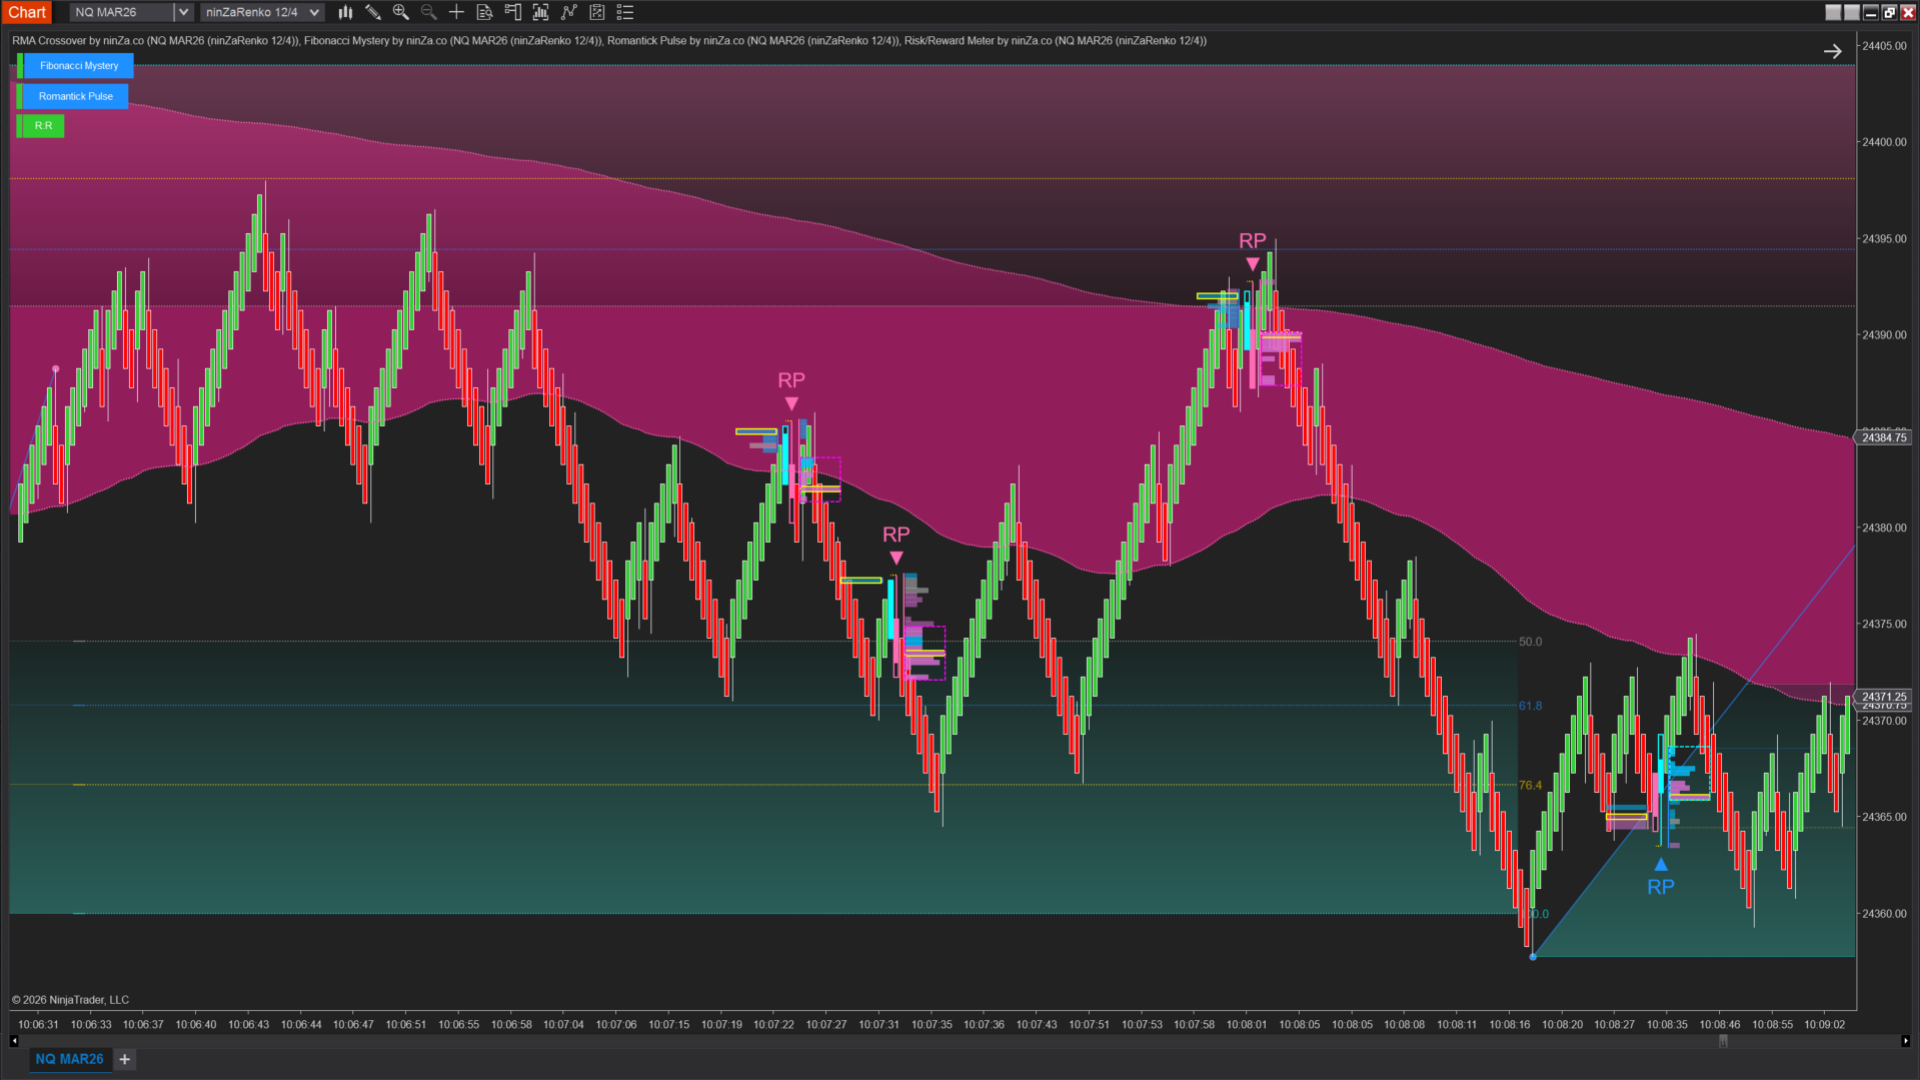
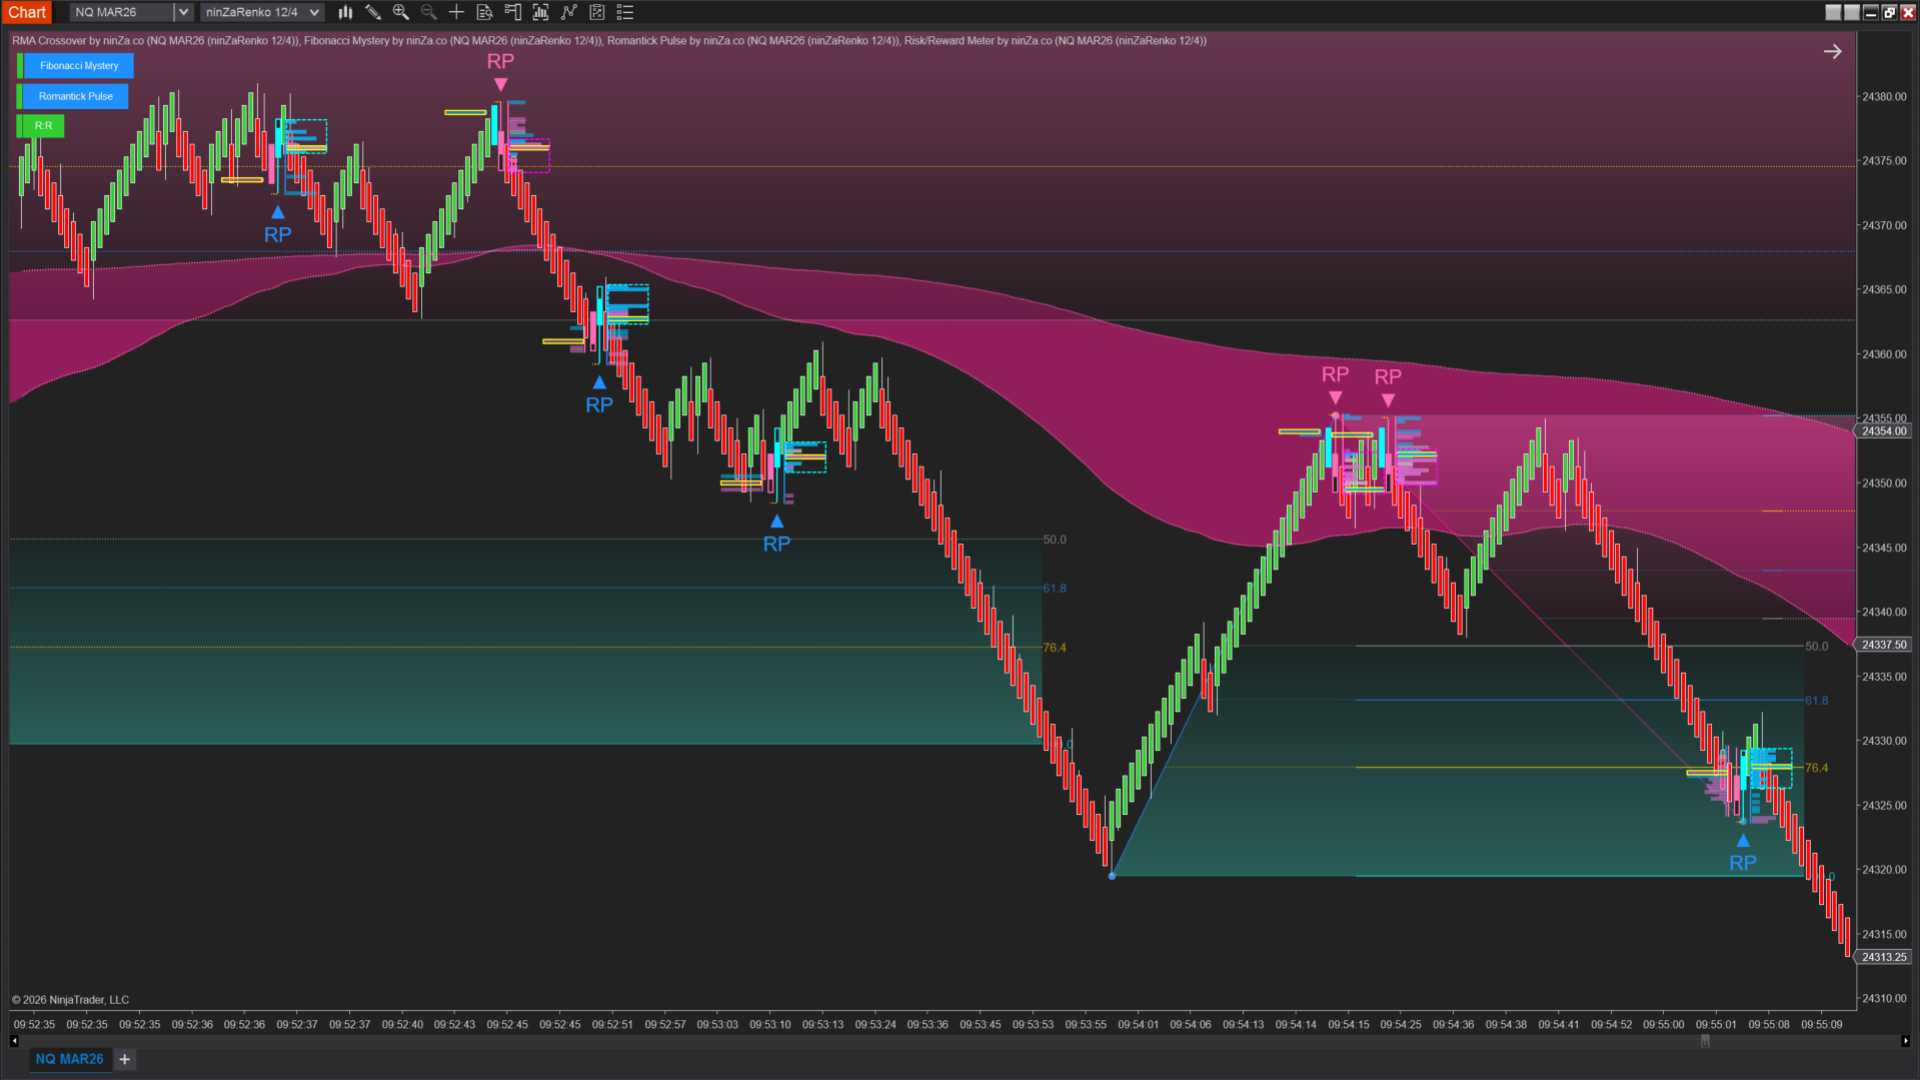
The strategy uses 2 types of zones depending on market momentum.
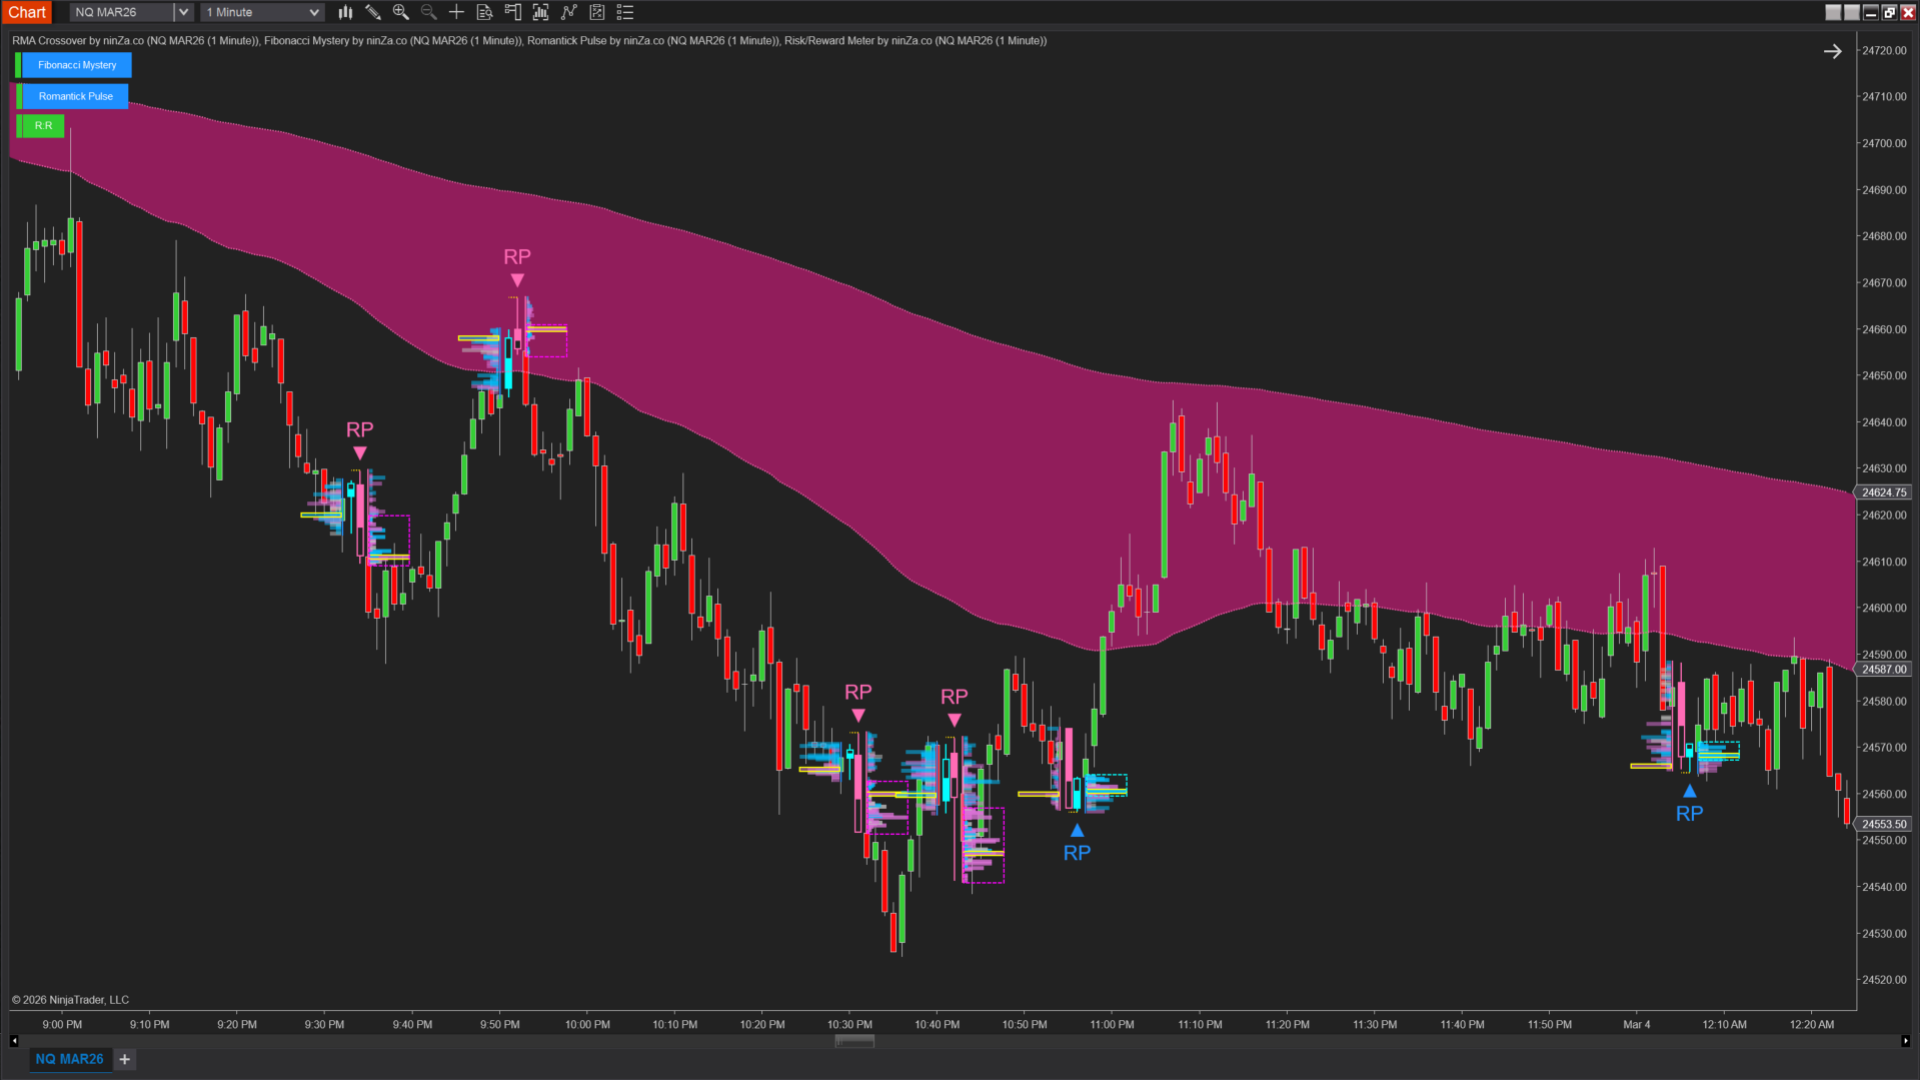
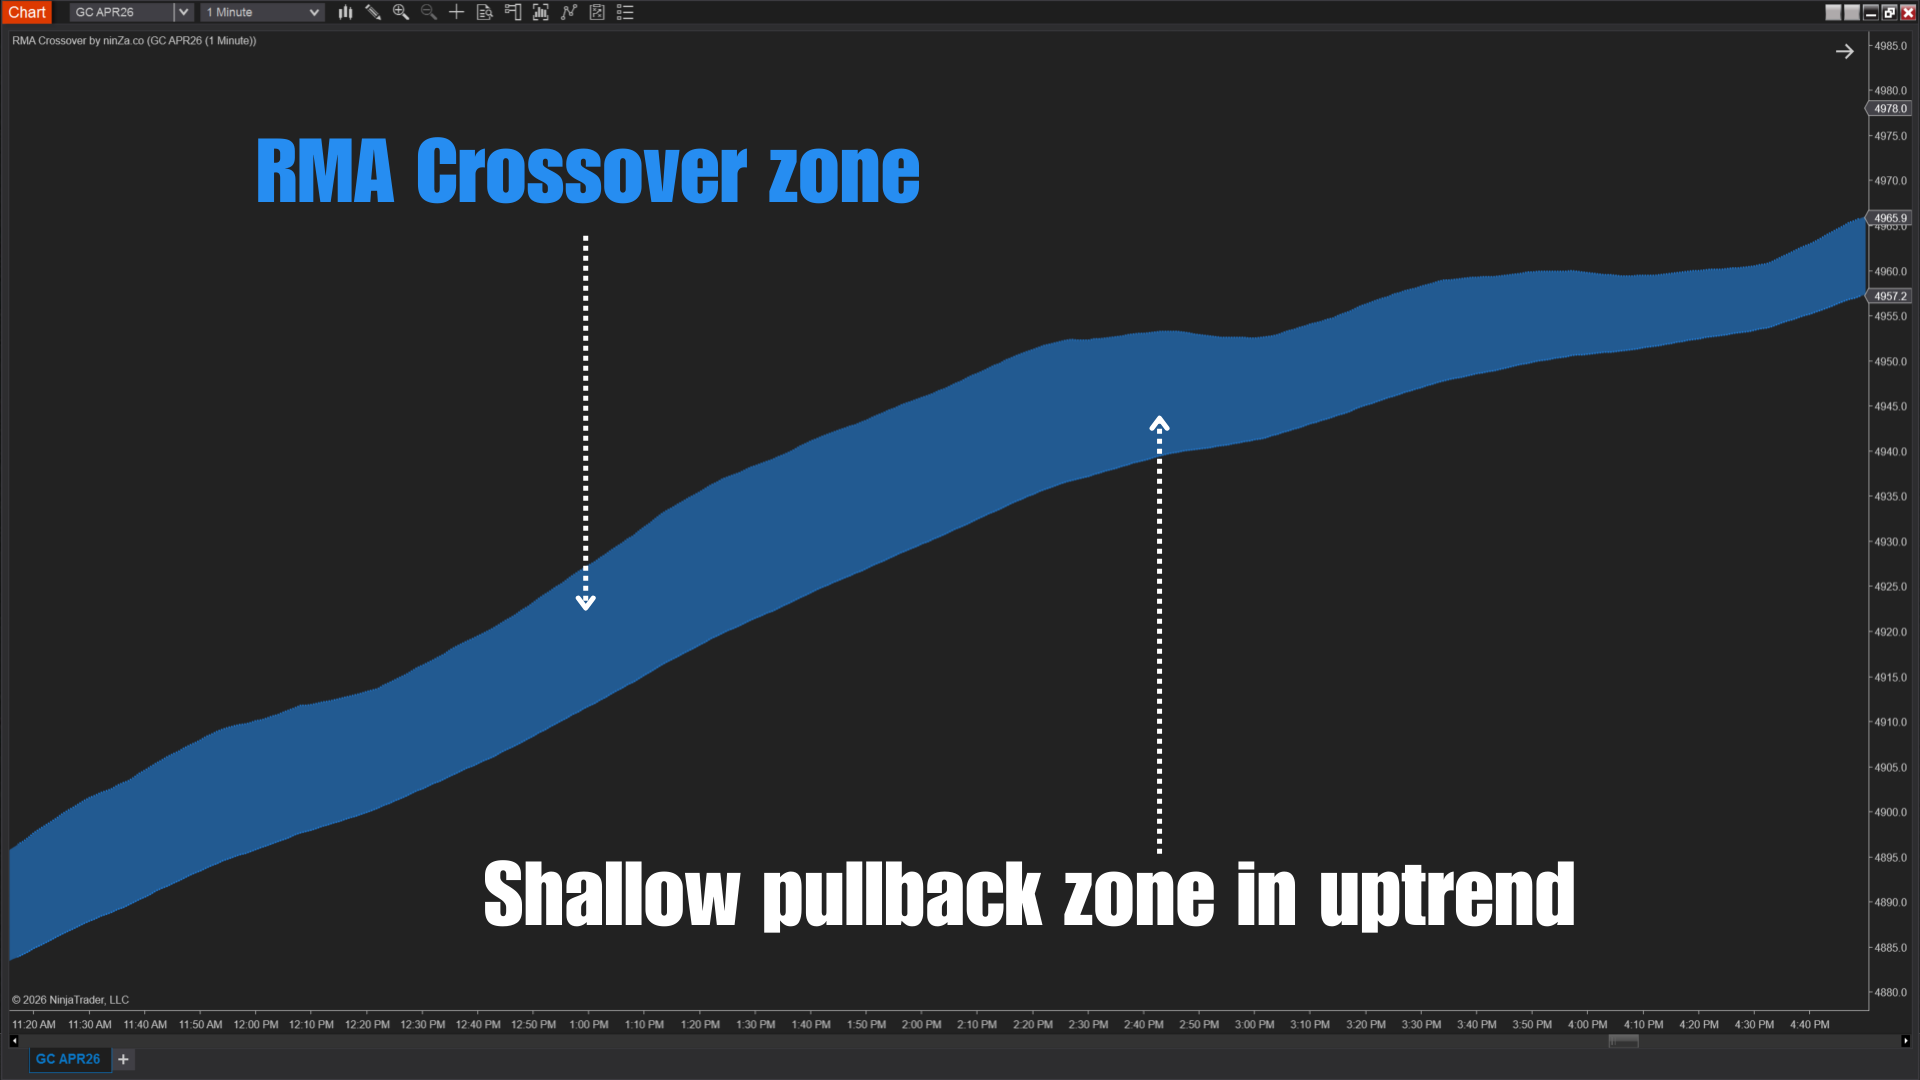
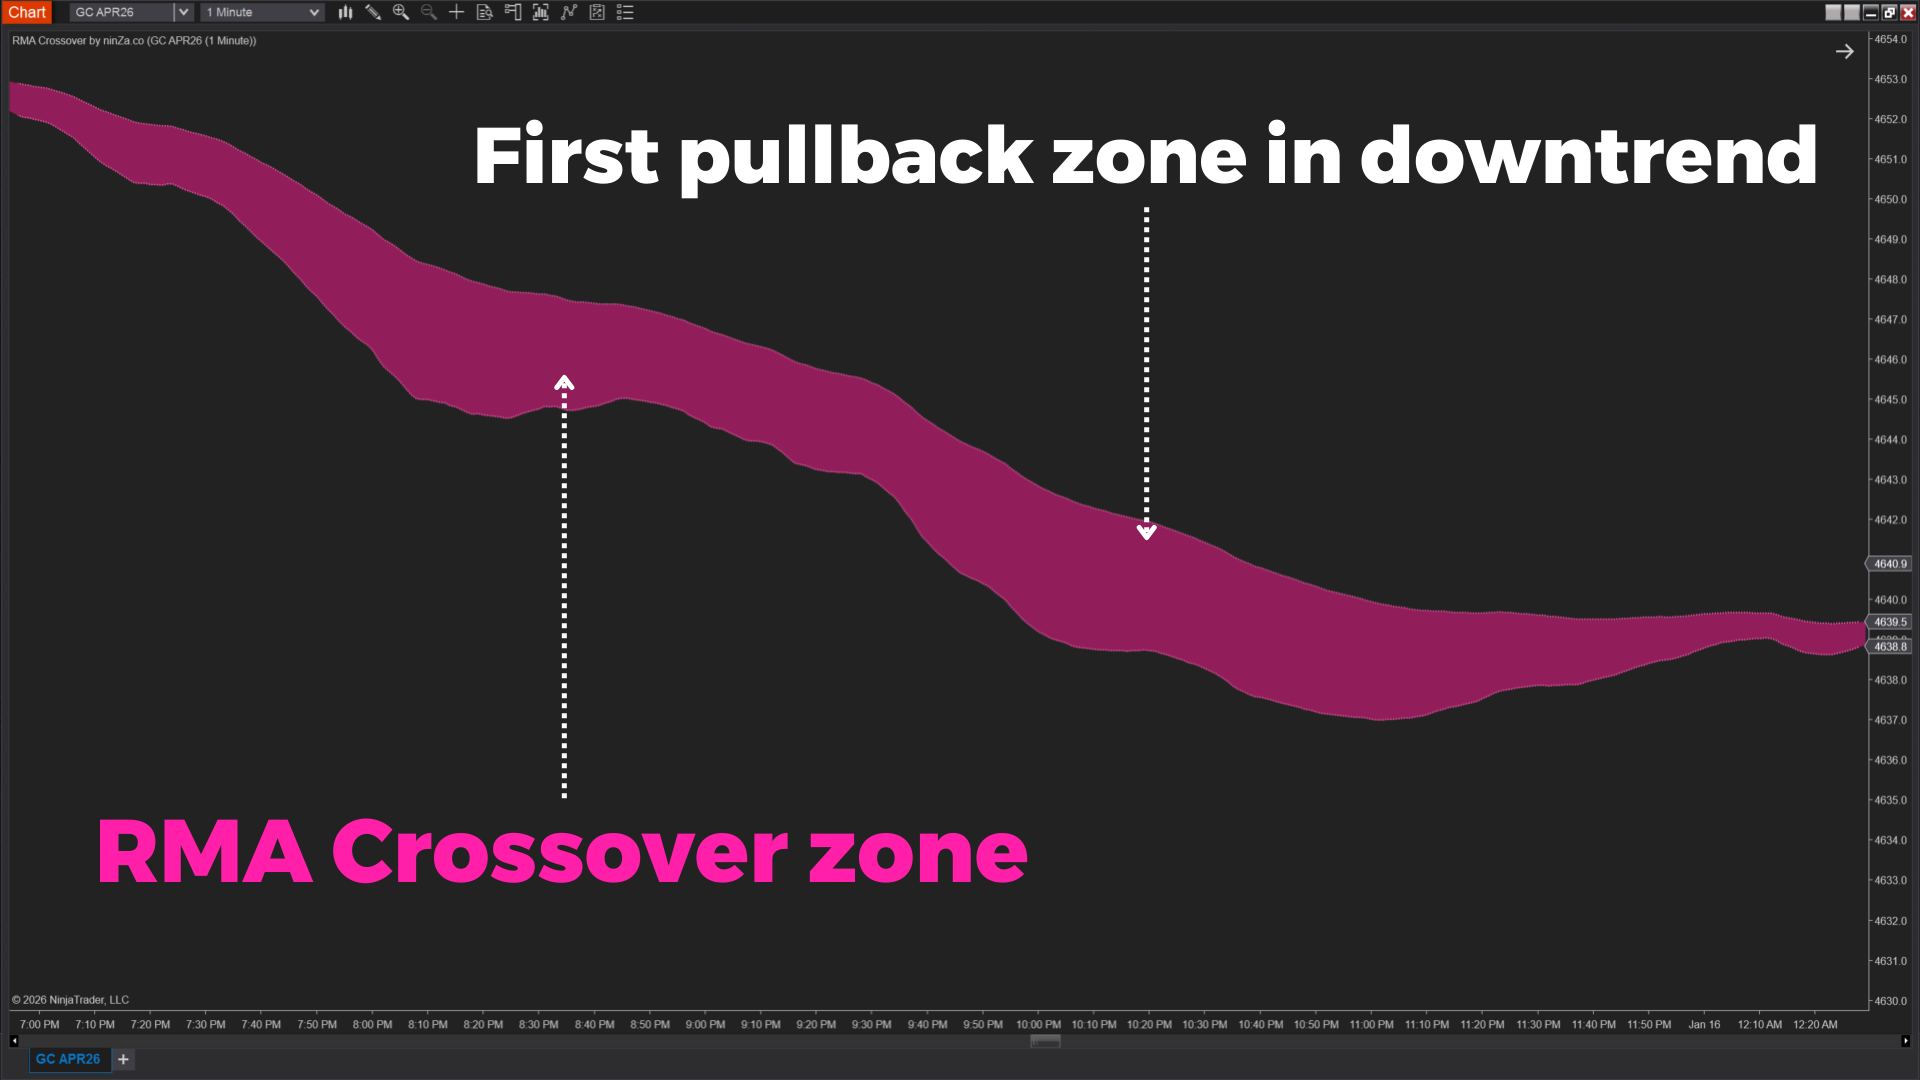
RMA Crossover Zones
These dynamic zones often capture shallow pullbacks when the trend momentum remains strong.
Fibonacci Mystery Zones
These zones help identify deeper retracement areas where price may return before the trend continues.
By separating shallow and deep pullbacks, the strategy allows you to anticipate different types of retracements instead of treating every pullback the same way.


Step 3: Wait for confirmation
Once price reaches a pullback zone, the final step is to wait for confirmation.
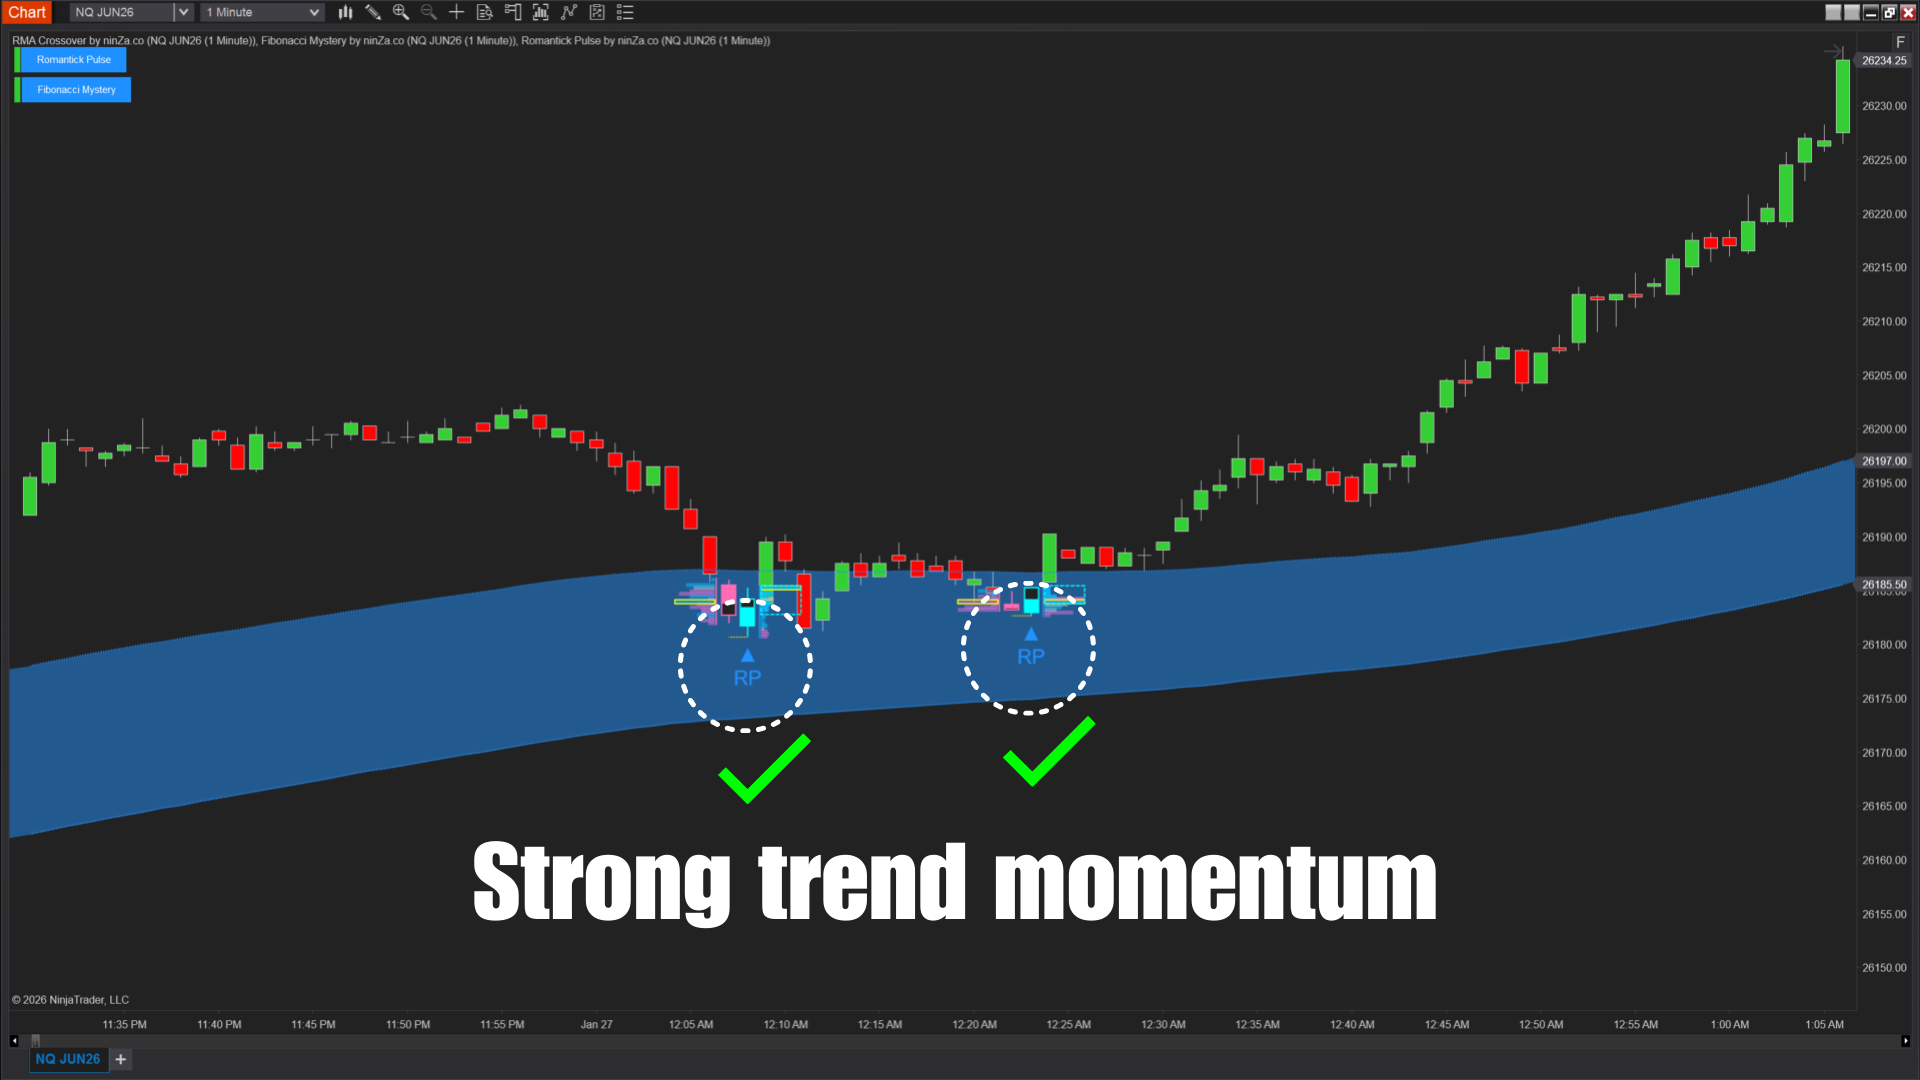
Romantick Pulse detects liquidity sweeps and analyzes order flow activity to determine whether market pressure is shifting back in the direction of the trend.
When a signal appears inside an RMA CrossOver or Fibonacci Mystery zone, it suggests that the pullback may be ending and the trend is ready to resume.
Why trade both Shallow and Deep pullbacks?
The Iron Oak Trading Package is designed around the idea of distinguishing between these 2 types of pullbacks.
This creates several practical advantages when trading trends:
Clearer distinction between pullbacks and reversals
By defining structured pullback zones, traders can better differentiate temporary retracements from actual trend reversals.
Better reward-to-risk opportunities with deep pullbacks
Deeper retracements often provide improved entry prices, allowing for tighter stops and larger potential reward relative to risk.
More frequent opportunities with shallow pullbacks
Shallow pullbacks occur more often during strong trends and tend to maintain higher continuation probability, allowing traders to participate more consistently in trending markets.
The logic behind Iron Oak Trading Package
1. RMA Crossover – Identifying the trend
The Running Moving Average (RMA) applies a smoothing method that filters out short-term noise while preserving the overall market direction.
A stable trend indicator is particularly important for pullback strategies. Deep retracements can sometimes appear large enough to look like a trend reversal. When this happens, weaker trend indicators may generate misleading signals.
The RMA Crossover provides a smoother representation of the dominant trend, helping you distinguish between normal pullbacks within a trend and actual trend reversals.
This makes it easier to stay aligned with the broader market direction while waiting for pullback opportunities.


2. RMA Crossover & Fibonacci Mystery – Defining pullback zones
Once the trend is identified, the next step is determining where pullbacks are likely to occur.
The strategy uses 2 different types of zones to account for varying market momentum.
RMA Crossover Zones – Shallow Pullbacks
In strong trends, price often makes short-term pullbacks before continuing in the direction of the trend.Because the Fast and Slow RMA move with price, they naturally act as dynamic support and resistance levels. Many shallow pullbacks occur around these moving averages as traders re-enter the market during strong momentum.
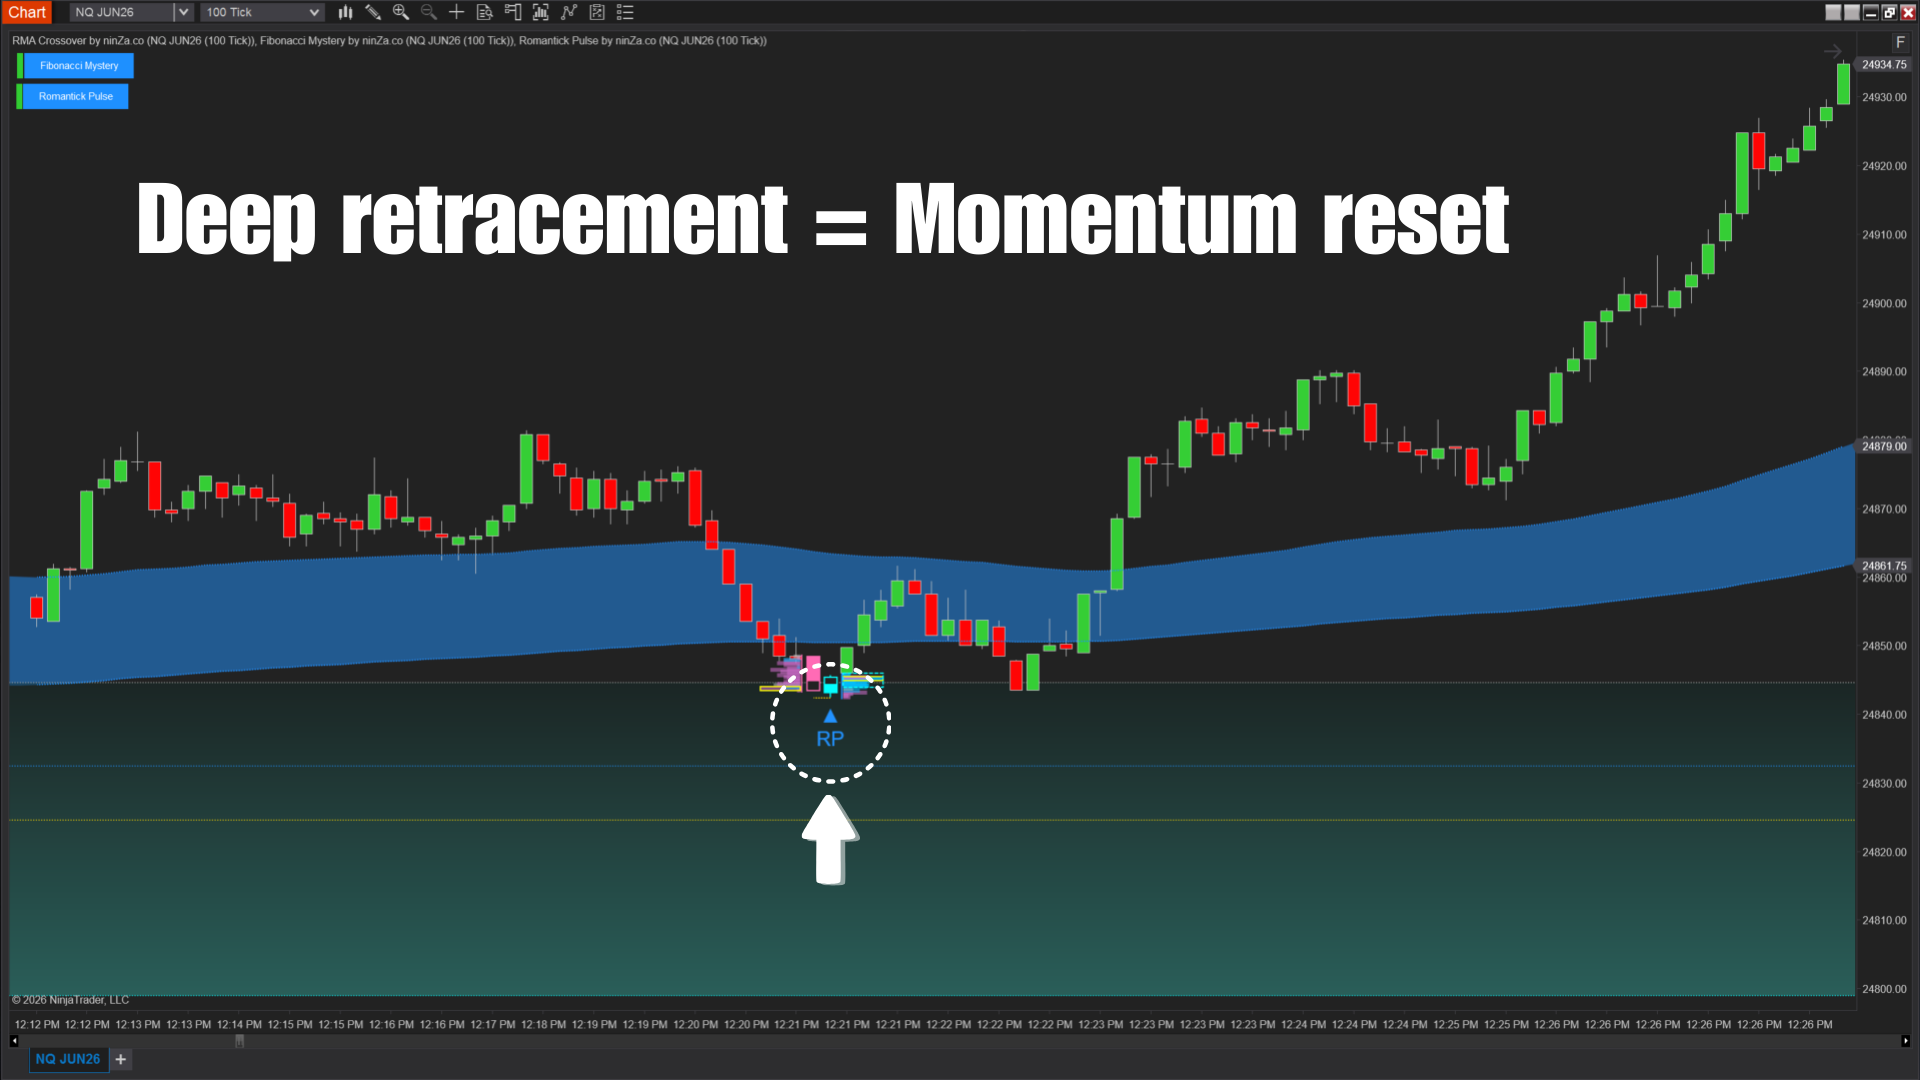
Fibonacci Mystery Zones – Deep Pullbacks
When momentum begins to slow, pullbacks often extend deeper into the market structure.
The Fibonacci Mystery indicator identifies these deeper retracement areas by building zones from major reversal points.
It detects the final swing of the previous trend and the first swing in the new direction, then constructs a zone using key Fibonacci retracement levels such as 38.2%, 50%, and 61.8%.
When price moves beyond short-term moving average support, it often searches for stronger structural levels. In many cases, this leads price back toward these Fibonacci-based zones.
By highlighting these areas automatically, Fibonacci Mystery helps you focus on high-probability structural retracement levels instead of manually analyzing every swing.
3. Romantick Pulse – Confirming Pullback entries
After price reaches a pullback zone, the final step is confirming whether the trend is likely to resume.
Romantick Pulse analyzes liquidity behavior and order flow activity to identify potential entry signals.
The indicator first detects liquidity sweeps by tracking a bull–bear candle pair that signals opposing intent in the market.
It then forms a box around the signal candle and analyzes the trading activity occurring inside and outside the box.
To highlight stronger setups, the indicator also evaluates:
• Delta shifts to determine which side is gaining control
• Total volume relative to the previous candle to confirm participation
By combining liquidity sweeps, order flow imbalance, and volume confirmation, Romantick Pulse filters out weaker signals and helps you focus on situations where directional pressure is clearly shifting back toward the trend.

Trading tip: When to trade Shallow vs Deep Pullbacks
Shallow Pullbacks
Shallow pullback signals are best traded during the early and middle stages of a strong trend, where continuation probability tends to be higher.
During these phases, market momentum remains strong, so price usually retraces only briefly before continuing in the direction of the trend.
However, if price reaches the Fibonacci Mystery zone very early in a trend, it may indicate that the trend lacks strong momentum and could be more vulnerable to reversal. In such cases, it is generally better to avoid trading shallow pullback signals.
Deep Pullbacks
Deep pullback signals are generally more reliable after several shallow pullback signals have already occurred, or when the trend has already developed a reasonable move.
In these situations, a deeper retracement often represents a temporary reset of market momentum rather than a trend reversal.
See how Iron Oak Trading works in LIVE markets
In these videos, you will see the demo Buy/Sell signals of Iron Oak Trading:
Here is the 30-day backtest result of Iron Oak Trading on GC!


Let’s answer some common questions
Choose your favorable pricing option below
Core Value option
+ (1) license of RMA Crossover: $400 value
+ (1) license of Fibonacci Mystery: $700 value
+ (1) license of Romantick Pulse: $600 value
+ Personalized support: $100 value
+ 1-year product update: $340 value
+ Trader’s manual & templates: $100 value
Now only
$696
Automated Strategy option
+ (1) license of Infinity Algo Engine$: $2,700 value
+ (1) license of RMA Crossover: $400 value
+ (1) license of Fibonacci Mystery: $700 value
+ (1) license of Romantick Pulse: $600 value
+ Personalized support: $100 value
+ 1-year product update: $610 value
+ Trader’s manual & templates: $100 value
Now only
$1,356

Your purchase is secured at ZonixTrading
Use the indicators in real market conditions for 45 days.
If it doesn’t feel right for you, you can switch to another indicator through our Zuture Exchange policy – with little to no extra cost.
Get Started Today with Iron Oak Trading
Transform the way you trade pullbacks with Iron Oak Trading.
This package combines trend detection, pullback zone mapping, and liquidity-based confirmations into a single, powerful system designed for consistent success.