Unlock the power of data-driven trading with QuantZone: Achieve higher win probabilities in every trade
Powered by advanced probability modeling, QuantZone calculates real-time risk, reward, and success probabilities, helping you trade smarter with clear, data-backed decisions.

Do you actually have an Edge?
You take a setup that looks clean → it loses
You skip a setup → it works perfectly
You get stopped out → then price moves exactly as expected
After a while, one question keeps coming back:
“Do I actually have an edge… or am I just reacting to what looks good in the moment?”
The problem is: In the short term, outcomes are noisy and inconsistent.
A winning trade doesn’t always mean the setup was right.
A losing trade doesn’t always mean it was wrong.
While retail traders focus on “clean setups”… Larger players don’t trade that way.
They don’t enter a trade just because it looks good. They measure:
- how much they are risking
- how much they expect to make
- and the probability of that outcome
Without that layer of measurement, every trade becomes a guess – even if it looks perfect on the chart.
Introducing QuantZone: From guessing to measured decisions
QuantZone is built to answer the questions every trader faces:
“Is this trade statistically worth taking?”
And more importantly, “does the current price zone actually offer an edge?”.
Instead of relying on fixed patterns or signals, it shows:
- Where price has historically led to higher-probability outcomes
- How much risk is typically involved
- How far price is likely to move if the setup works
All calculations use a rolling sample, continuously updating with new data and removing outdated behavior – so probabilities reflect current market conditions.
QuantZone treats every price swing as a data sample. Each move – up or down – becomes a recorded case.

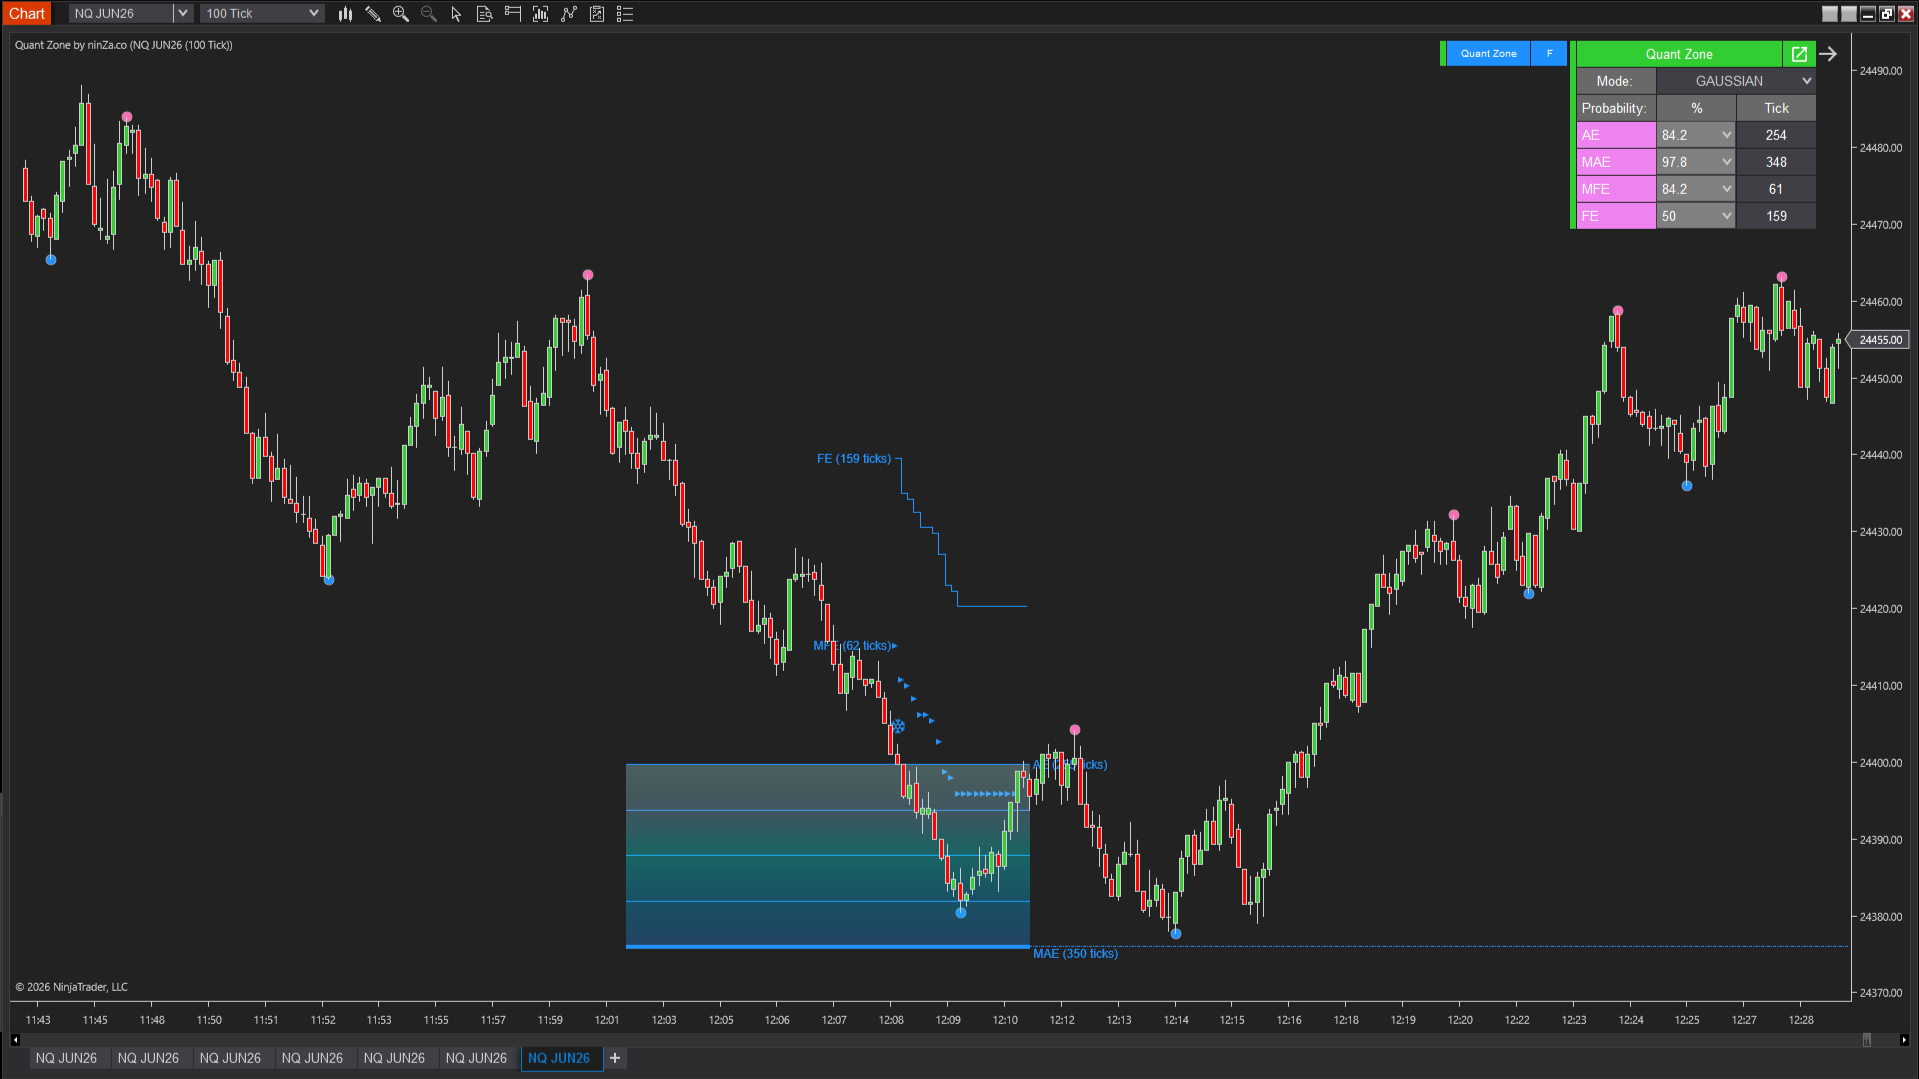
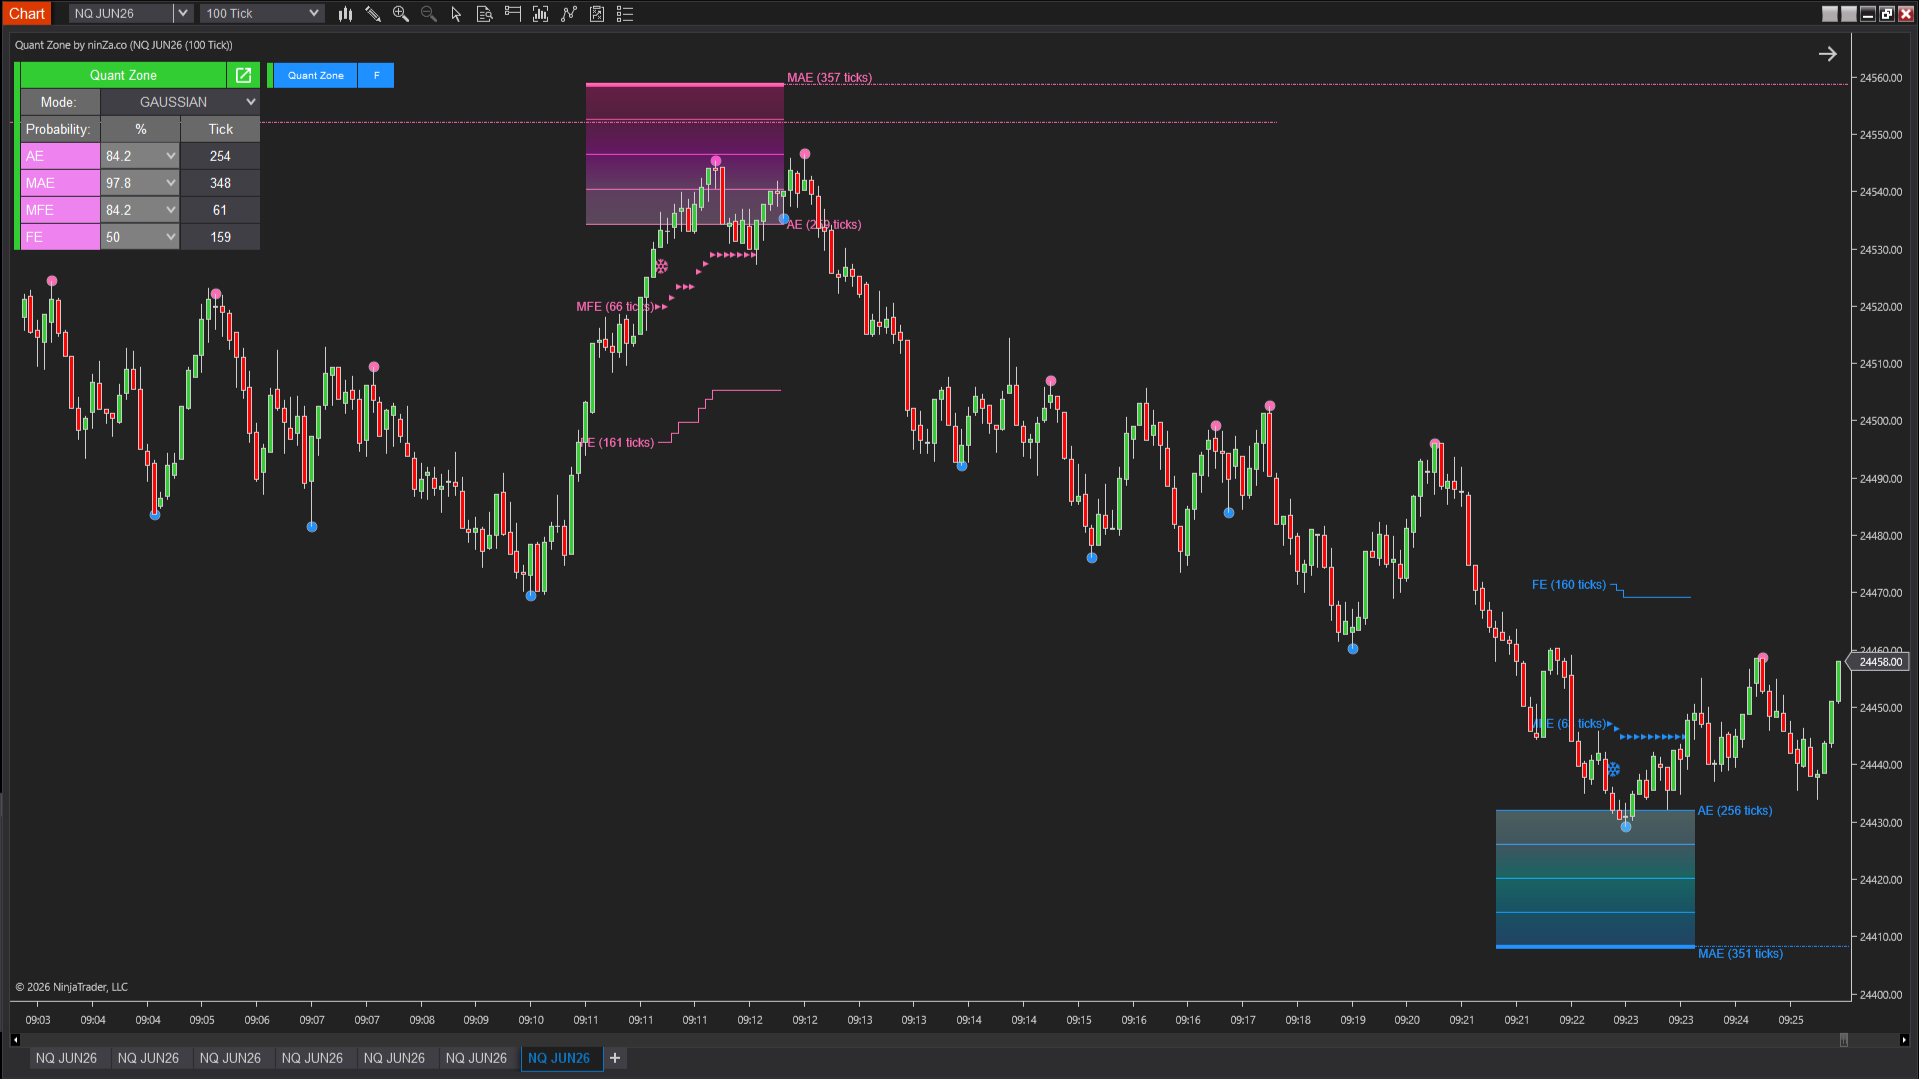
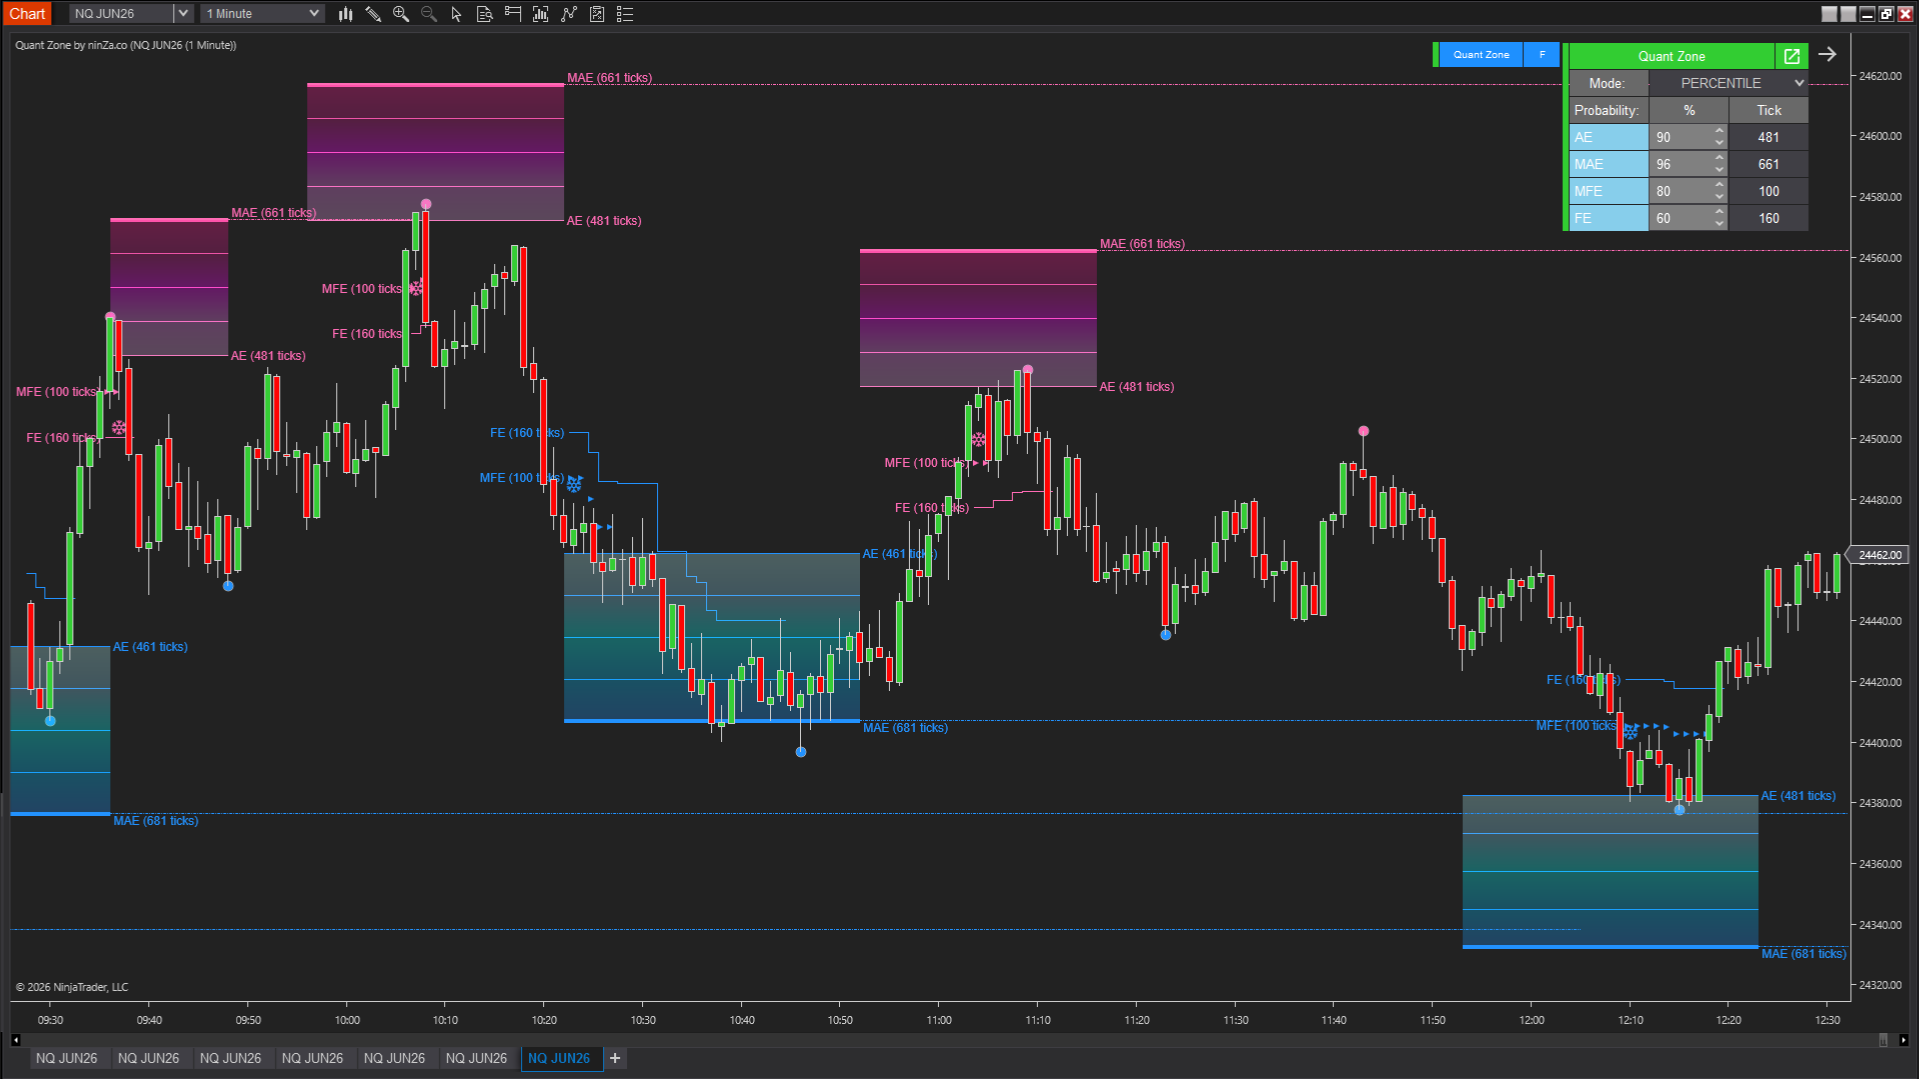
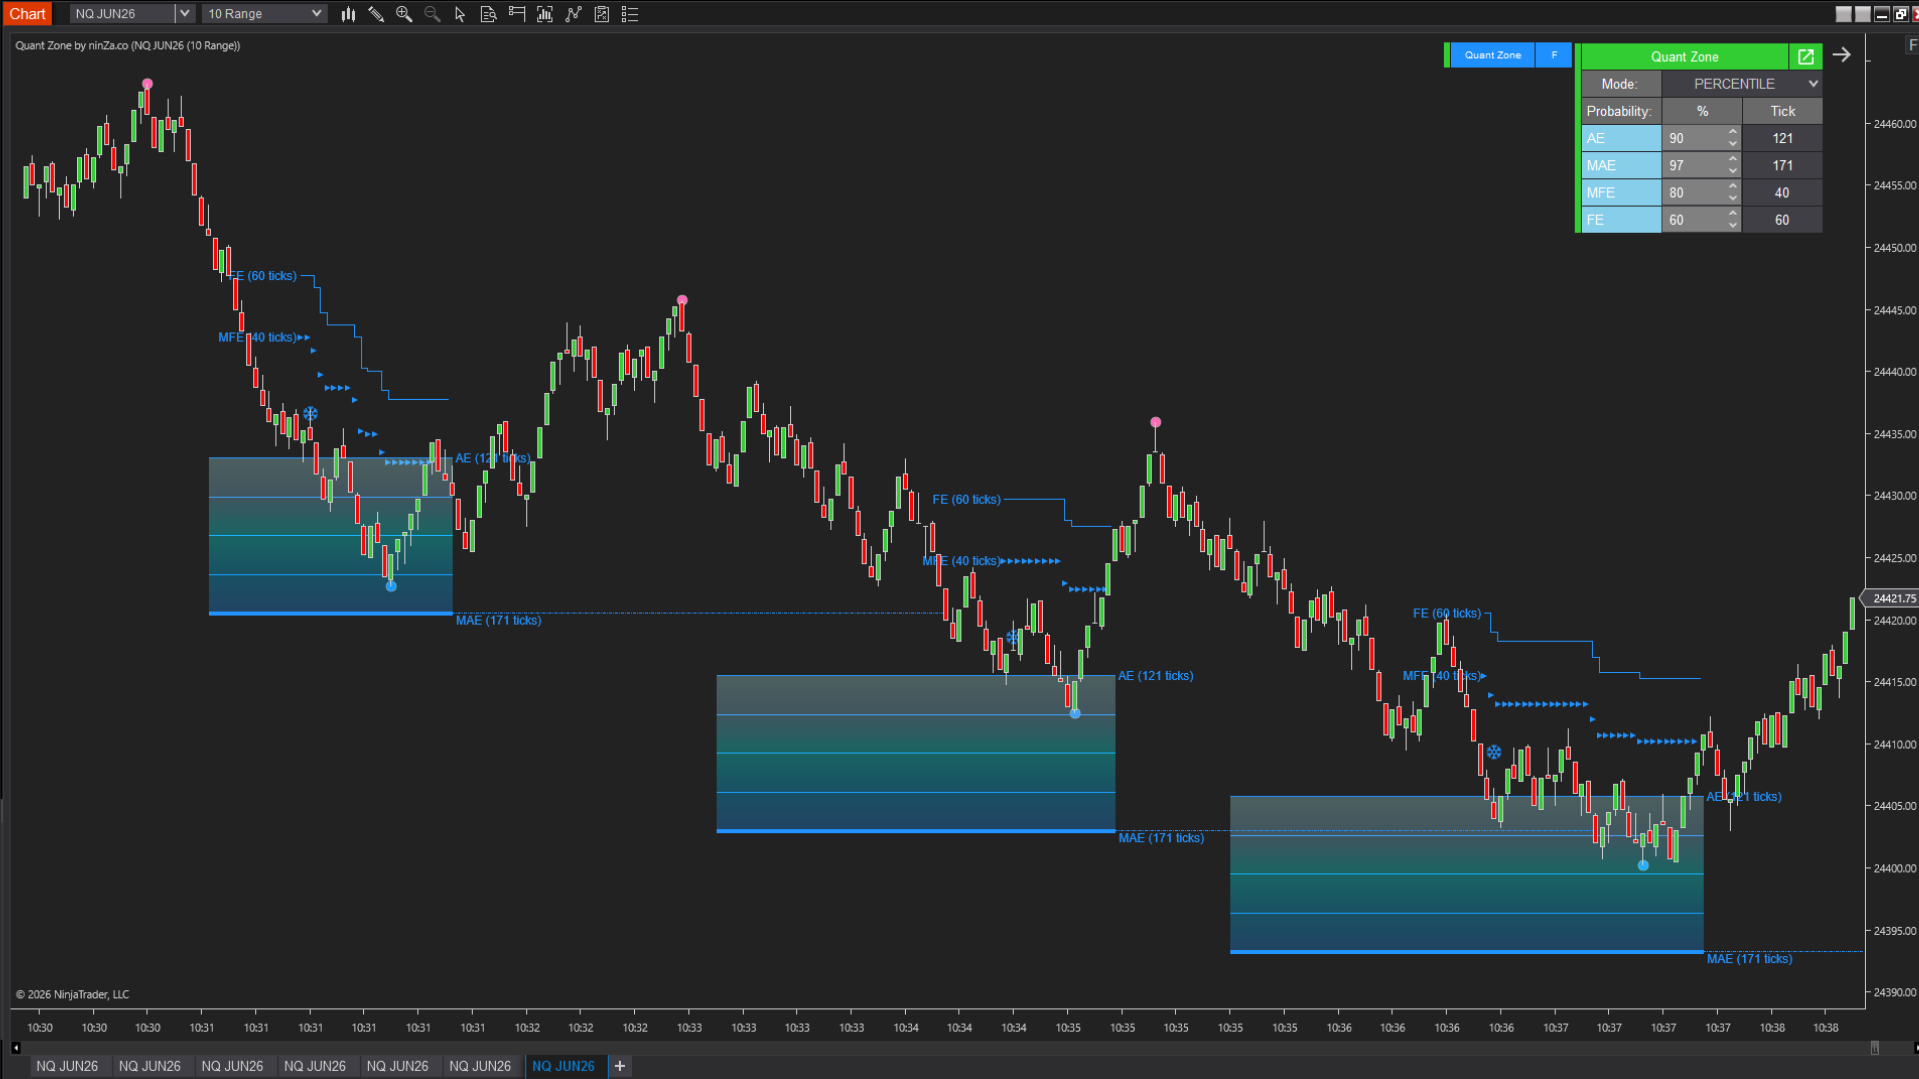
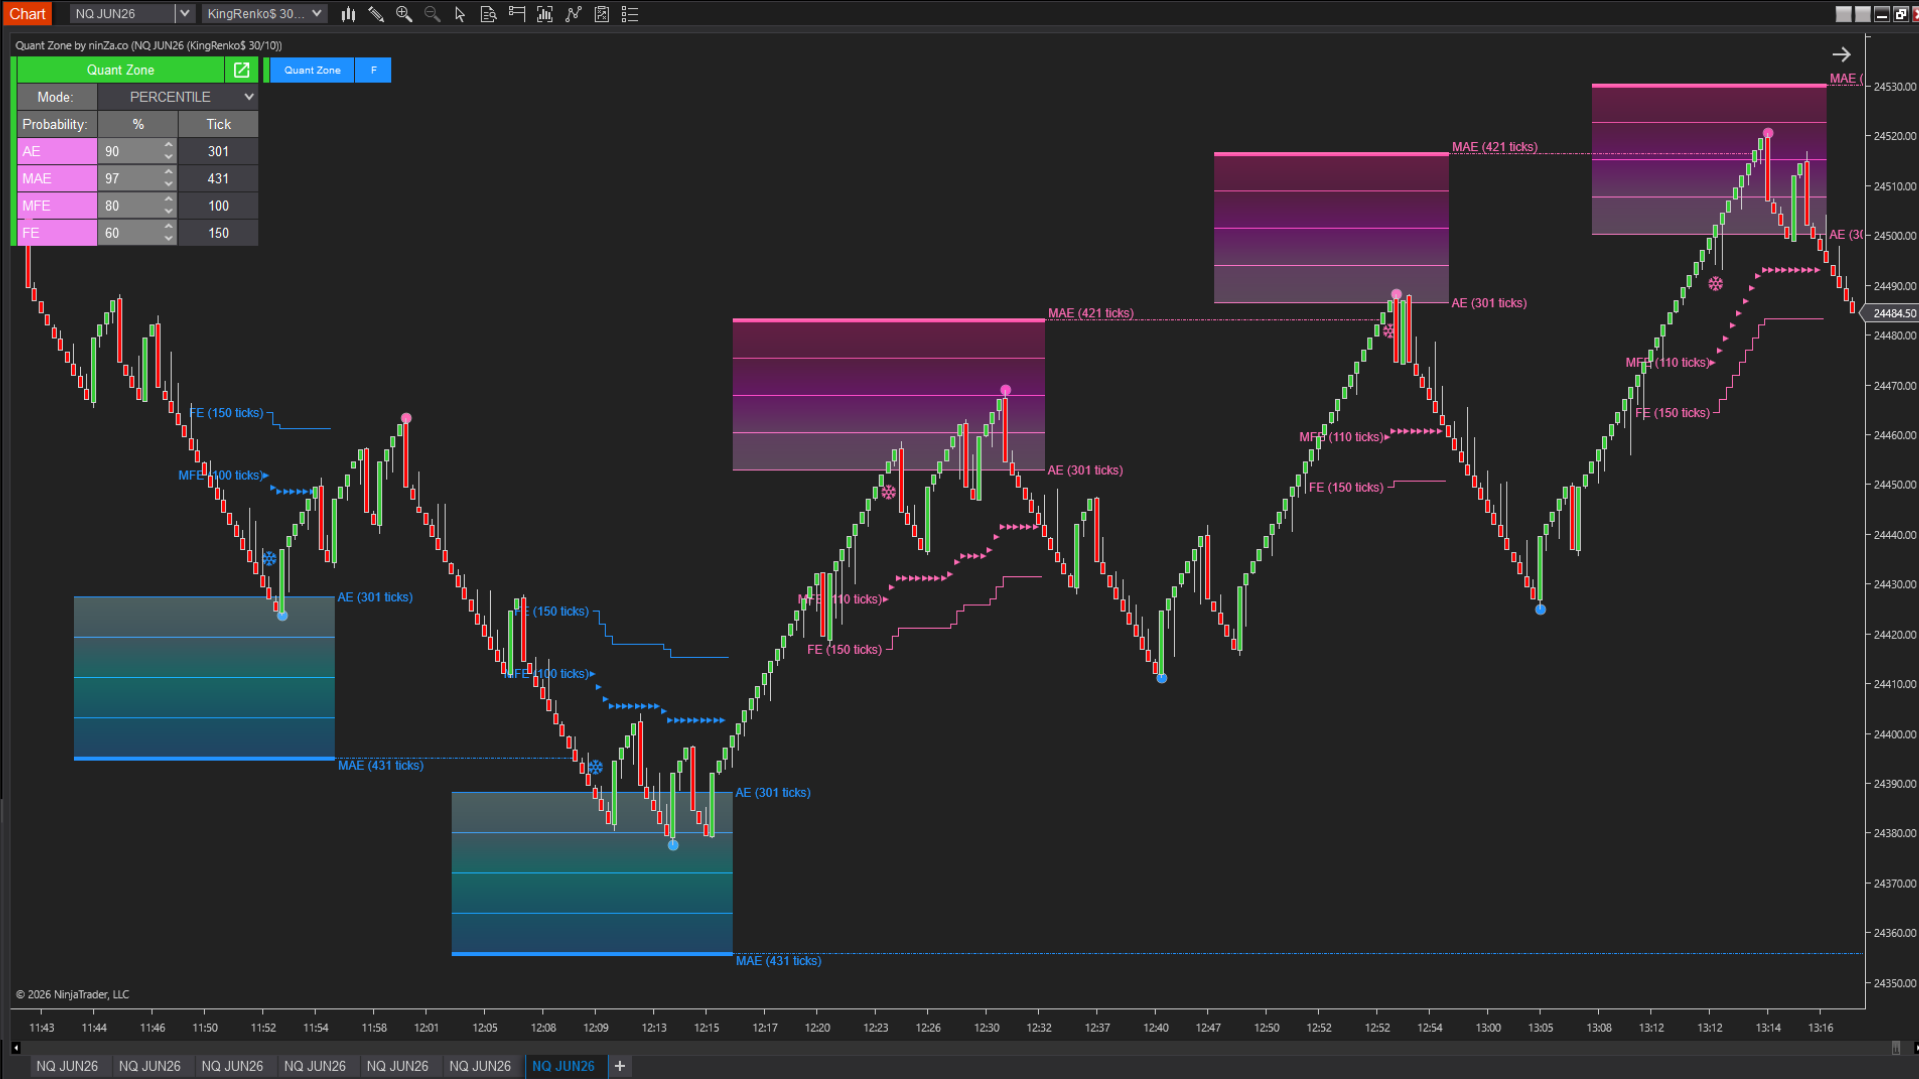
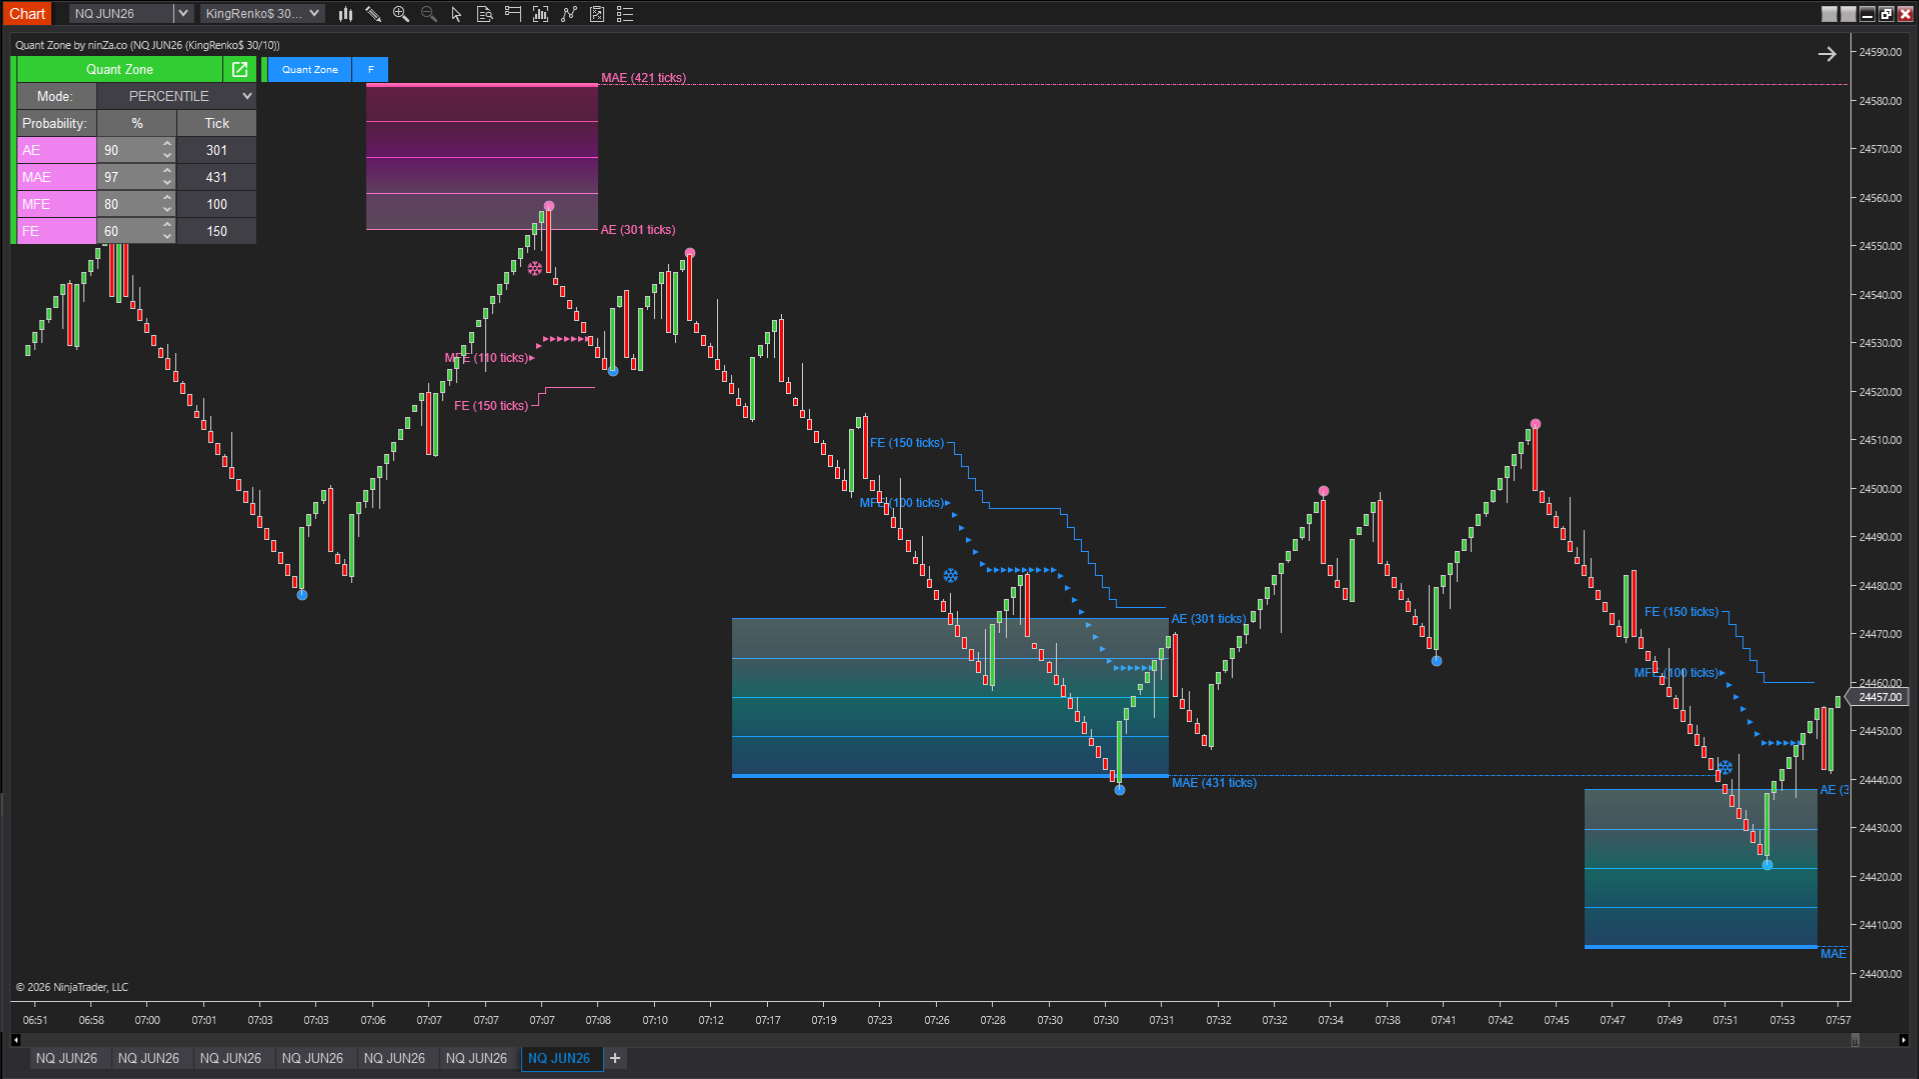


For every case, two key metrics are measured:
- MAE (Maximum Adverse Excursion) → how far price moves against you
- MFE (Maximum Favorable Excursion) → how far price moves in your favor
From this, it calculates the probability of reaching a target using the Joint Probability Model:
Pwin = P( F ≥ MFE ∩ A ≤ MAE)
In practical terms, this means:
Given a maximum acceptable drawdown, what is the probability that price will reach your target?
So, instead of thinking: “This setup looks strong”.
You start thinking: “If I risk X, the probability of reaching Y is Z%”
A data-driven way to evaluate every trade
When a setup forms, QuantZone helps you answer 4 key questions:
1. Is this a high-probability zone?
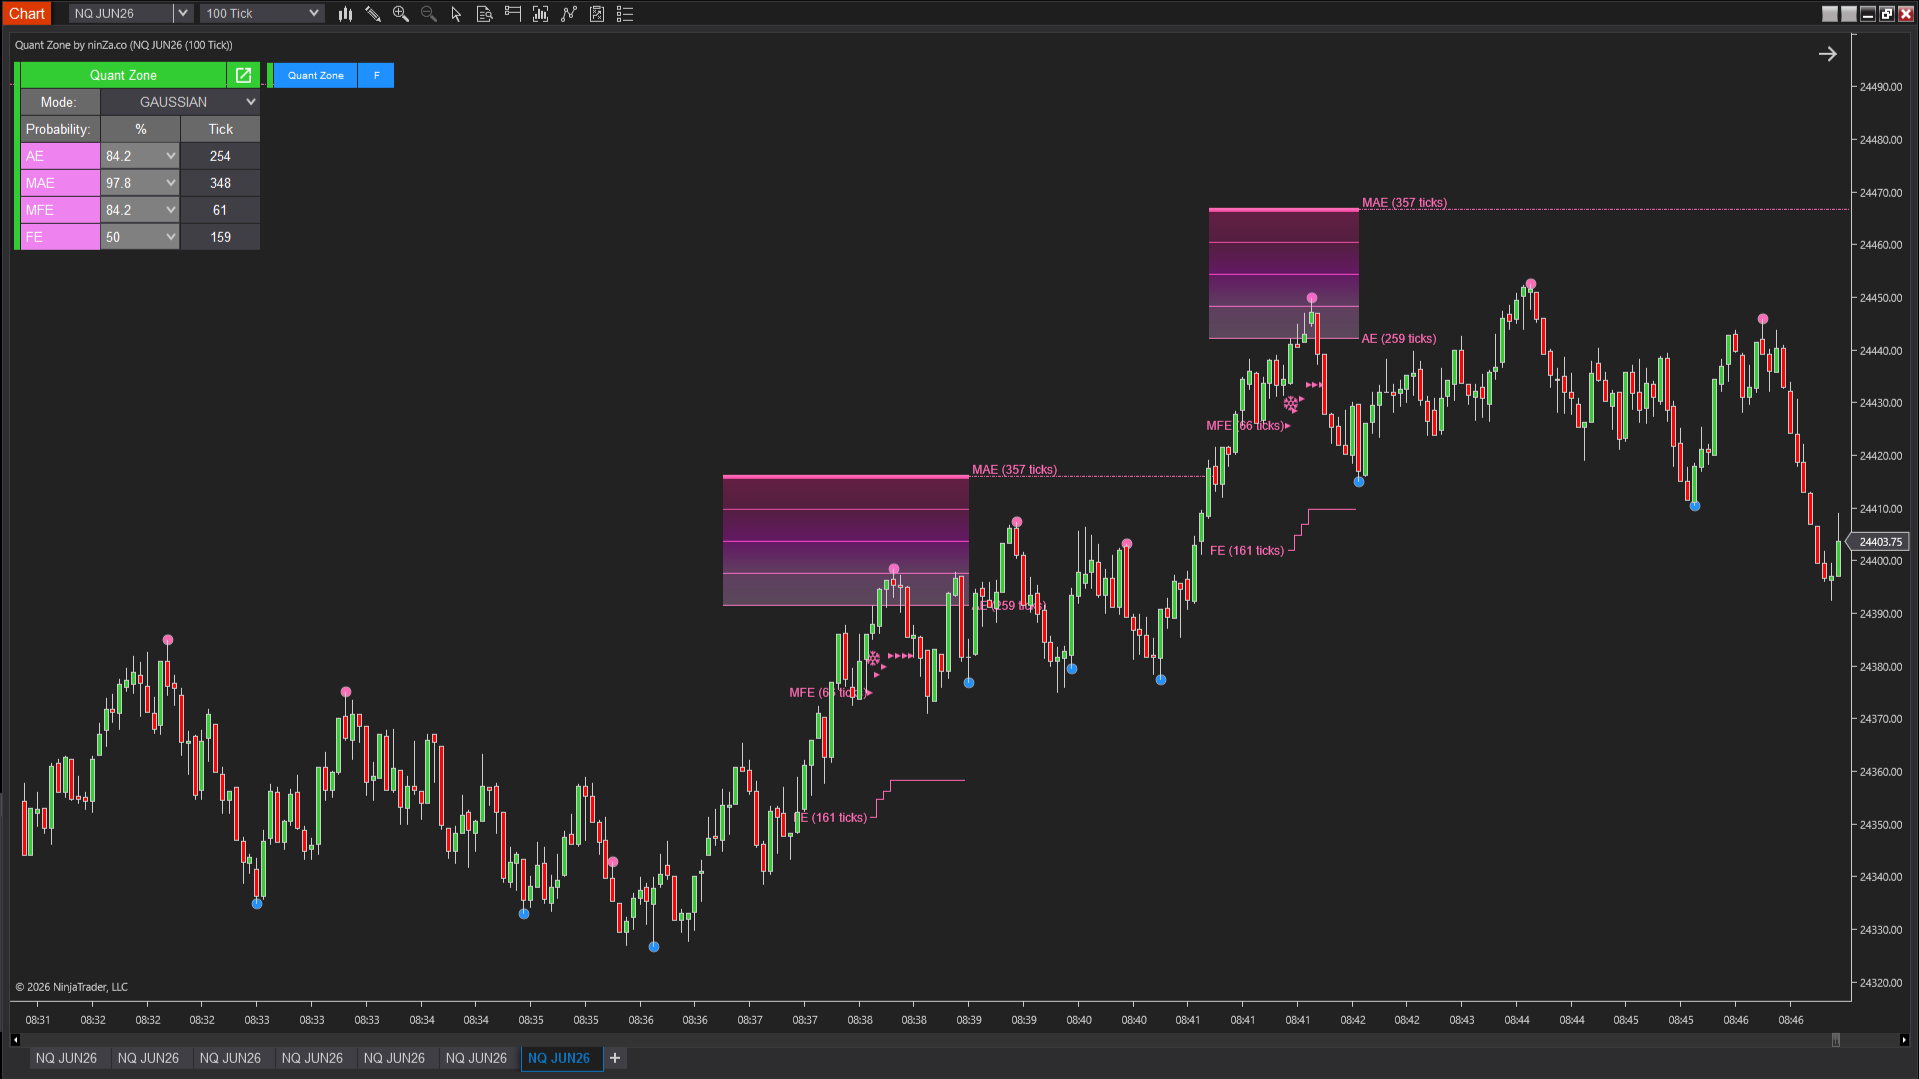
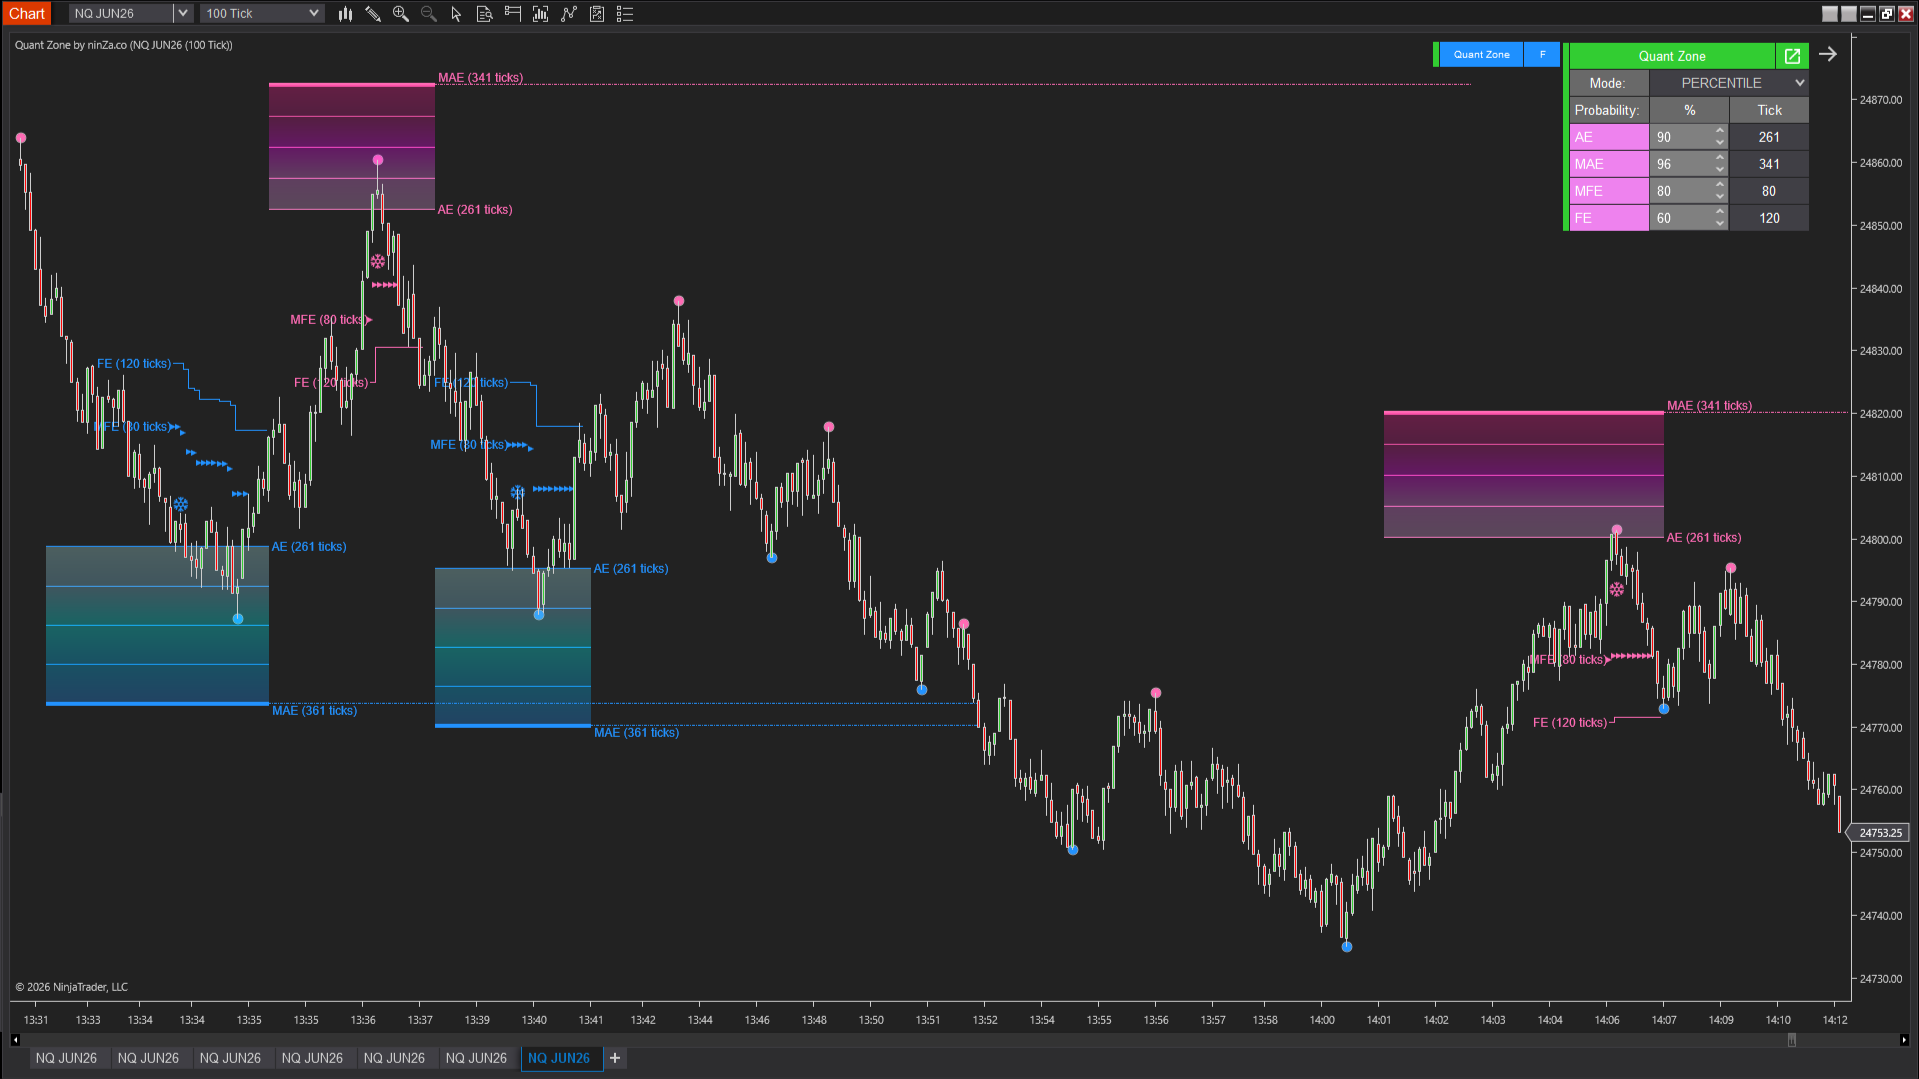
The indicator highlights Probability Zones – areas derived from historical data where favorable outcomes are statistically more likely.
→ If price is inside a strong zone, it’s worth attention
→ If not, you can skip the trade
2. Is the risk acceptable?
Using MAE (Maximum Adverse Excursion), QuantZone shows how far price typically moves against you.
→ Helps define a realistic stop-loss based on data, not guesswork
3. Is the reward worth it?
Using MFE (Maximum Favorable Excursion), it shows how far price tends to move when the setup works.
→ Helps set targets grounded in actual price behavior
4. Does the trade make sense overall?
You can quickly assess:
- Probability of success
- Risk vs reward
- Whether this setup is worth taking
→ No more “this looks good” – every decision is backed by data
Webinar replay: How QuantZone’s probability zones boost your win rate
In this session, you’ll discover:
- How QuantZone identifies high-probability reversal zones
- How probability (%) applies to trading decisions
- Key statistical concepts – Gaussian distribution & Percentile – and how they apply to market behavior
Eliminate discretionary trading and focus on high-confidence setups through a complete confluence framework.
The QuantZone + Super JumpBoo$t + Captain Optimus Strong bundle helps you move beyond isolated signals by combining statistical edge, precision timing, and automated execution into one structured trading process.
[Live Trading] Capture 200 ticks in just 3 trades using QuantZone’s probability zones
Watch the video capturing 200+ ticks in 3 trades. This test uses trend, reversal signals, and QuantZone probability zones to assess reversal probability, resulting in over $1,000 in gains.
How Quantitative trading simplifies and enhances precision in trading
In this video, George introduces QuantZone, an indicator designed to bring the approach of quantitative trading firms directly to retail traders. Instead of relying on intuition, QuantZone uses statistical analysis to identify high-probability trading zones based on market behavior.
Watch the Edge play out in Real Time with QuantZone
In this video, QuantZone helps James Buchman successfully take trades right at the start of these waves using its data-driven analysis to identify high-probability zones for entry based on historical price behavior and market data.
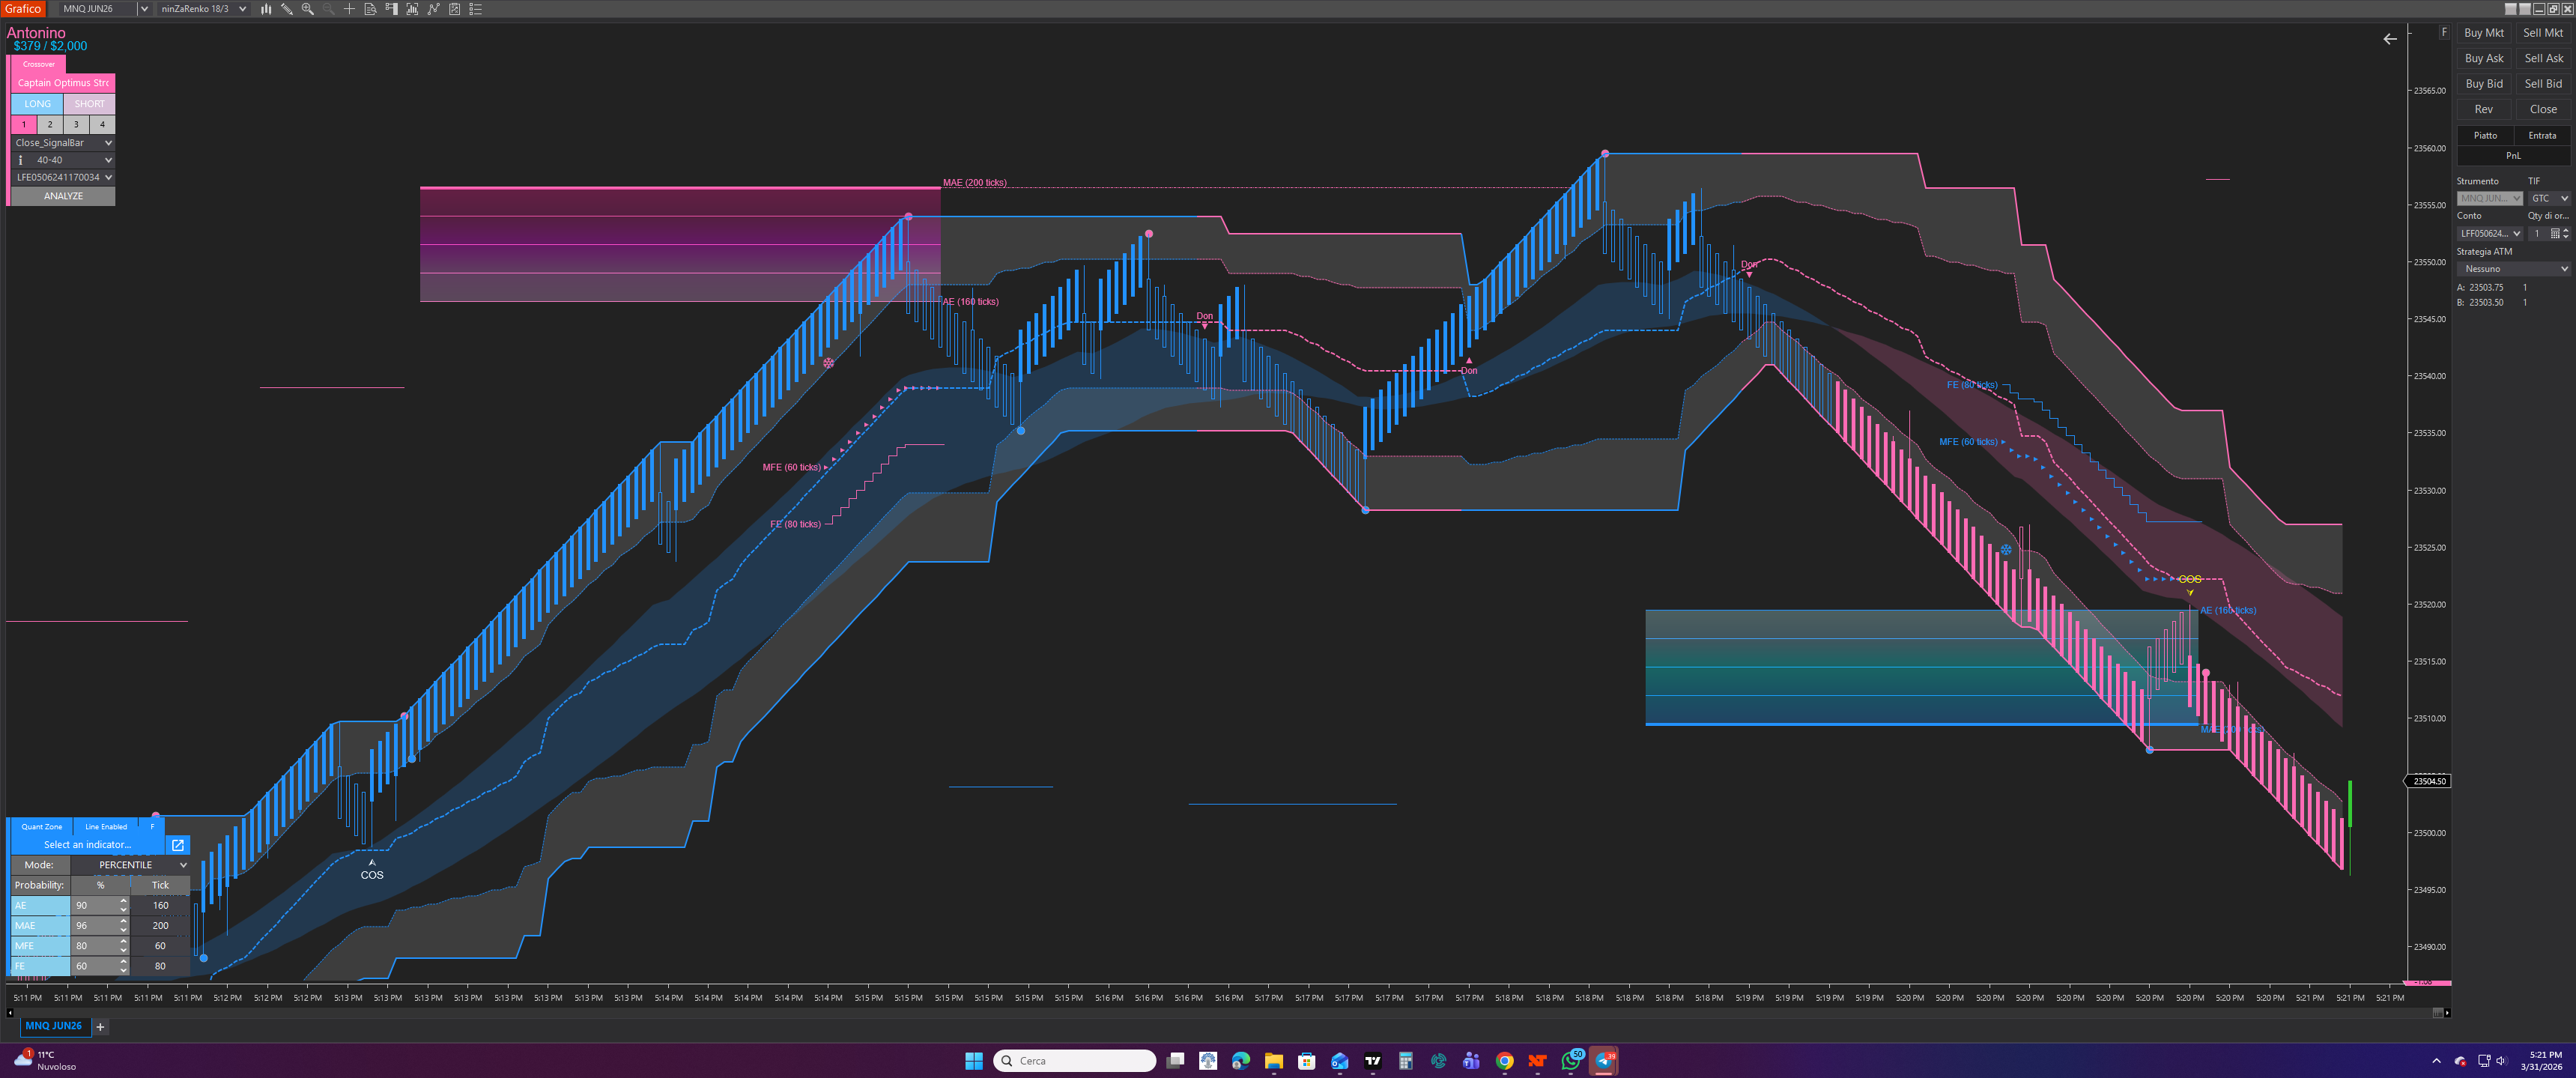
Let’s take a look at the demo signals of QuantZone!
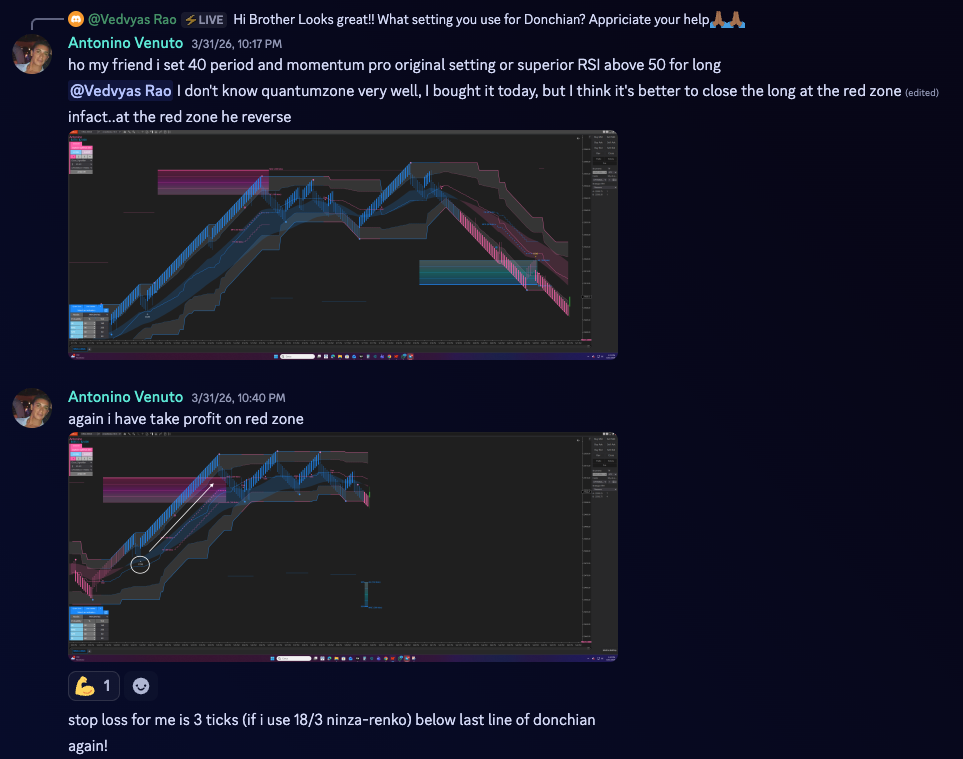
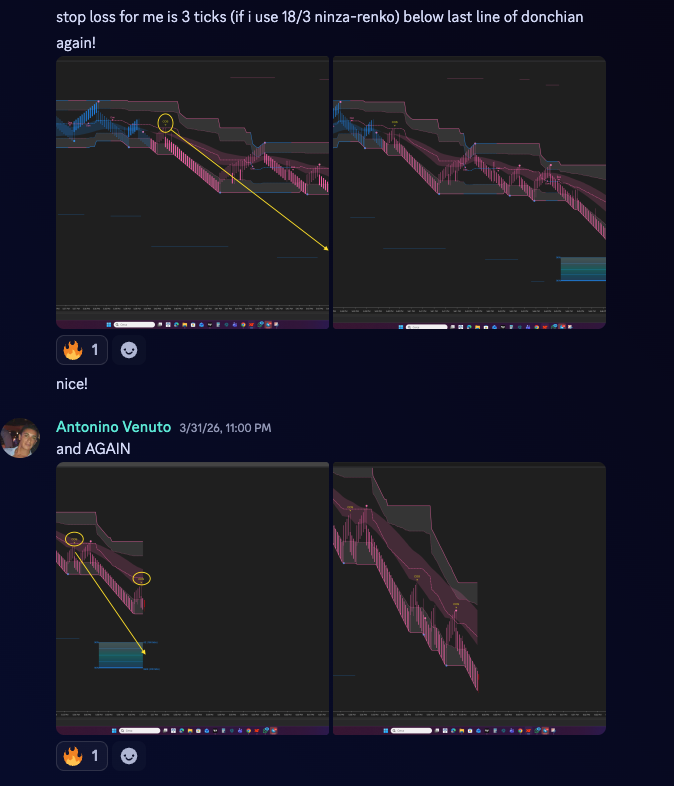
Check out how our pro trader Antonino applied QuantZone in his trades


What Traders usually ask
Special offers for YOU during the new release stage
Start trading with quantified confidence. Pick the setup that fits your strategy.

Option 1: QuantZone (Core System)
Perfect for traders who want a statistical edge in every trade
- Conditional Probability Model
- Probability Zones (Entries, Stops, Targets)
- Real-time Non-Repainting Signals
- Probability Table & Distribution Chart
- Full Indicator Access
Product value: $600
Now only: $300

Option 2: QuantZone + Super JumpBoo$t (Best Value)
For traders who want high-probability setups, precision entries
- Everything in QuantZone
- Super JumpBoo$t for high reward-to-risk entries
- Measure the edge before risking capital
- Align probability zones with precision entries
- Capture high R/R setups with greater confidence
Total value: $1,350
Now only: $550 (Limited Offer)

Option 3: QuantZone + ZonixRenko + Romantick Pulse (Advanced setup)
For traders who want structure + precision + clean price action
- Everything in QuantZone + Romantick Pulse
- ZonixRenko for noise-free market structure
- Focus only on real price movement (no noise candles)
- Clear trend direction and cleaner reversals
- Better clarity → better decisions → better consistency
Original price: $1,500
Now only: $600 (Limited Offer)

Option 4: QuantZone + Captain Optimus Strong (Automation suite)
For traders who want automation, execution, and full control
- Everything in QuantZone
- Captain Optimus Strong (automation system)
- Combine multiple indicators into one strategy
- Automatic trade execution with ATM strategies
- Backtest your strategy with historical data
- Set daily risk limits & trading sessions
- Build your own system – fully customizable
Total value: $2,200
Now only: $900 (Limited Offer)
Your purchase is covered within 30 days
Use the indicators in real market conditions for 30 days.
If it doesn’t feel right for you, you can switch to another indicator through our Zuture Exchange policy – with little to no extra cost.
Start Trading With Real Probabilities – Not Guesswork
You’ve seen how QuantZone turns uncertainty into measurable edge.
Now it’s your turn to trade with clarity, confidence, and data.
