
See Only the Imbalances That Actually Matter – Not the Ones That Waste Your Trades
Imbalance Insight Matrix filters out weak, low-quality zones and highlights only those backed by real market participation and momentum.
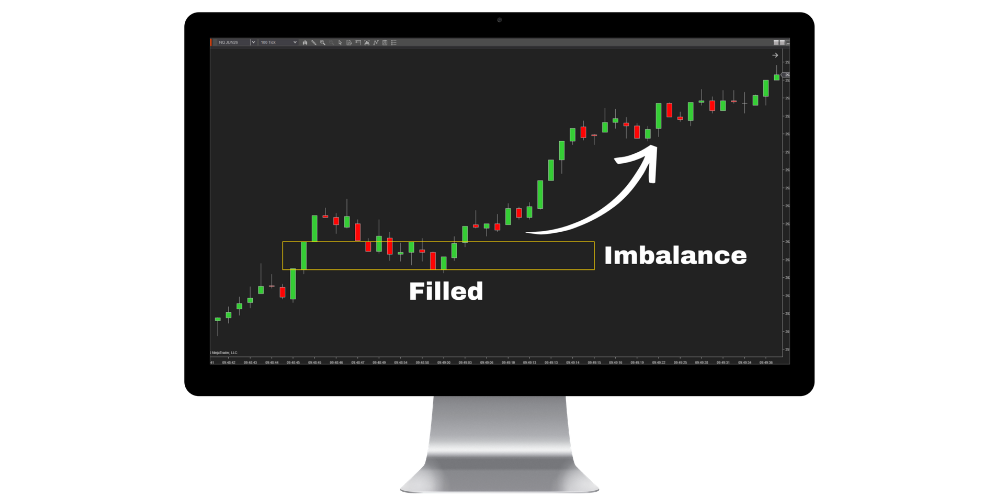
Imbalance creates opportunity, but only the right ones matter

Fast moves leave imbalance behind
When price moves too quickly, it leaves behind unfilled orders and liquidity.
The market doesn’t ignore these areas. It often returns to them before continuing its move. That’s where high-probability opportunities begin.

Imbalance reveals real participation
These moves don’t come from retail. They happen when large volume enters aggressively – leaving imbalance as a footprint.
That’s why imbalance shows where real participation took place.

Strong moves leave imbalance – and levels that matter
When price breaks structure and leaves imbalance, it signals real momentum.
Over time, these areas become key support and resistance – where price reacts and high-probability setups form.

But here’s the problem…
The market creates A LOT of imbalance zones.
- Some get filled immediately
- Some have no real follow-through
- Some appear in the wrong market conditions
And if you mark all of them… You don’t get clarity. You get overwhelmed.
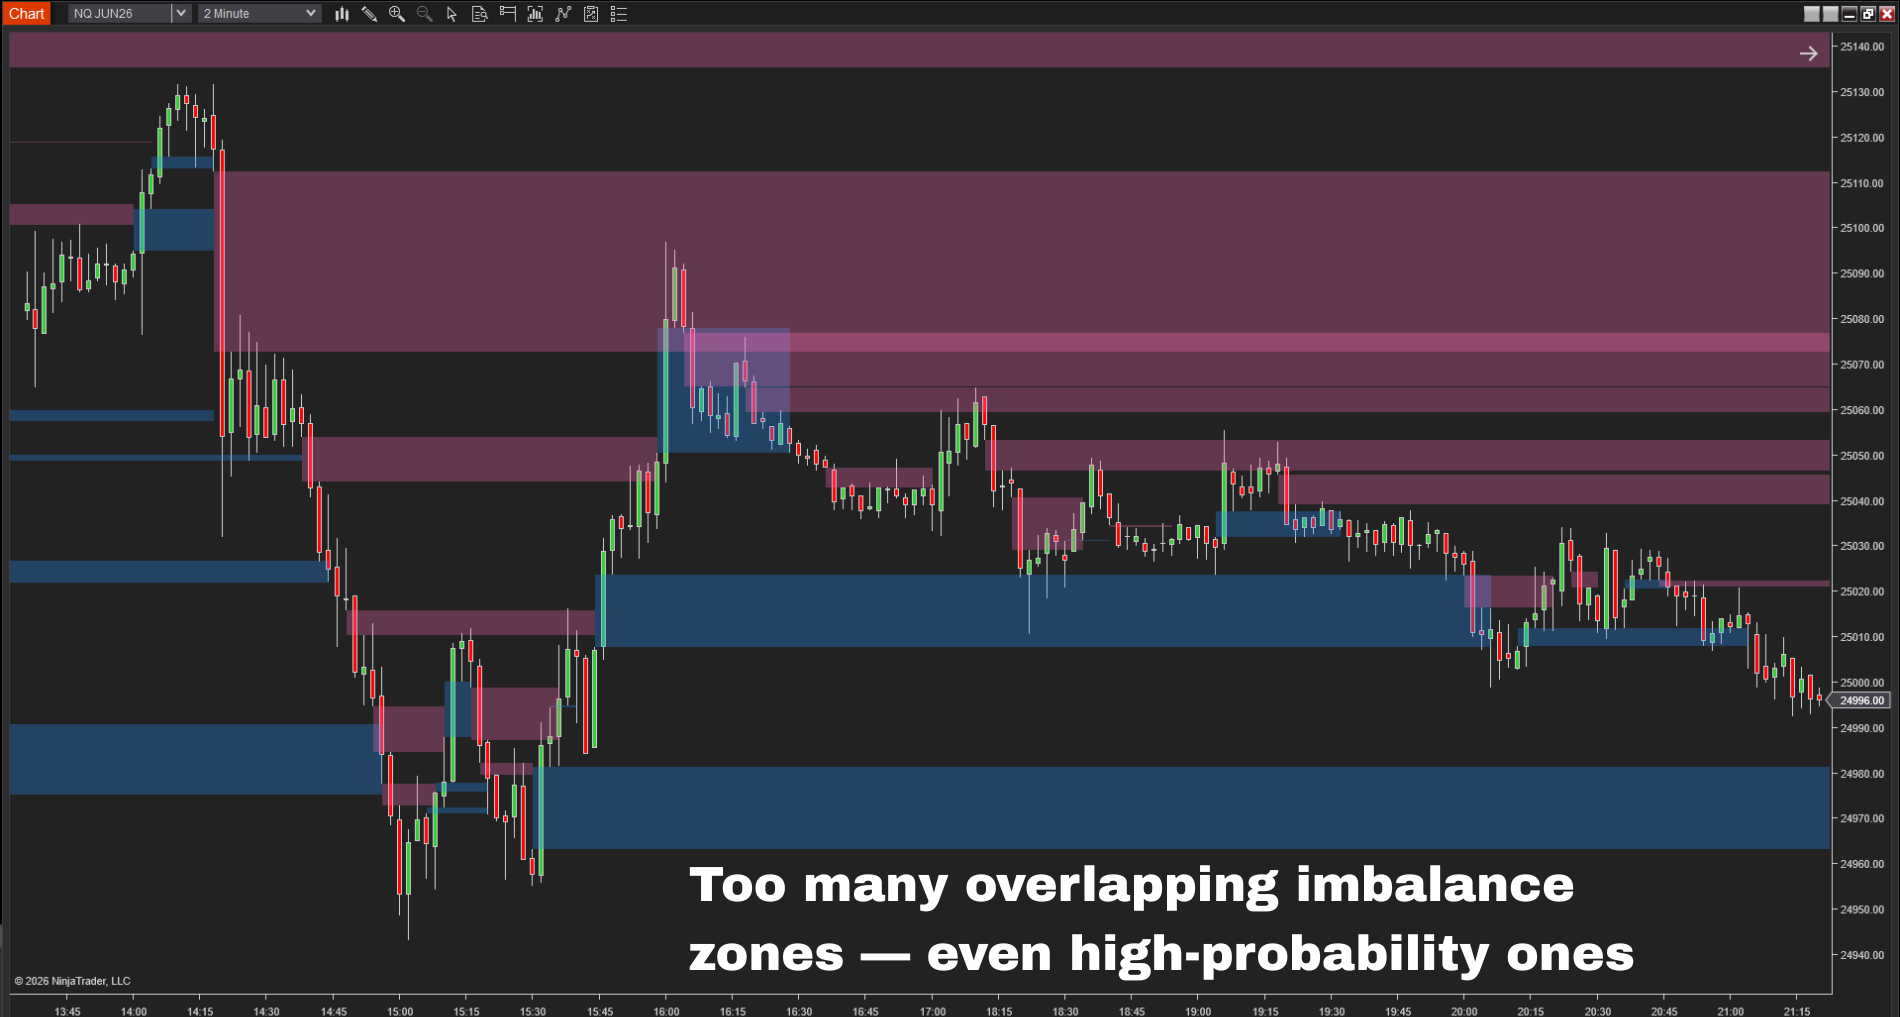
Too many imbalance zones appear at once — no clear structure, no clear decision point.
With Imbalance Insight Matrix, only high-quality imbalance remains
Now look at the same chart – filtered.

Only high-quality imbalance zones remain — cleaner chart, clearer focus.
Imbalance Insight Matrix isn’t just an indicator that simply plots imbalances – it isolates what actually matters:
- Filters out the noise and highlights only high-probability, tradable imbalances.
- Reveals where real institutional participation occurred
- Lets you focus on execution with clarity — not guesswork
Every zone must prove itself, or it doesn’t exist
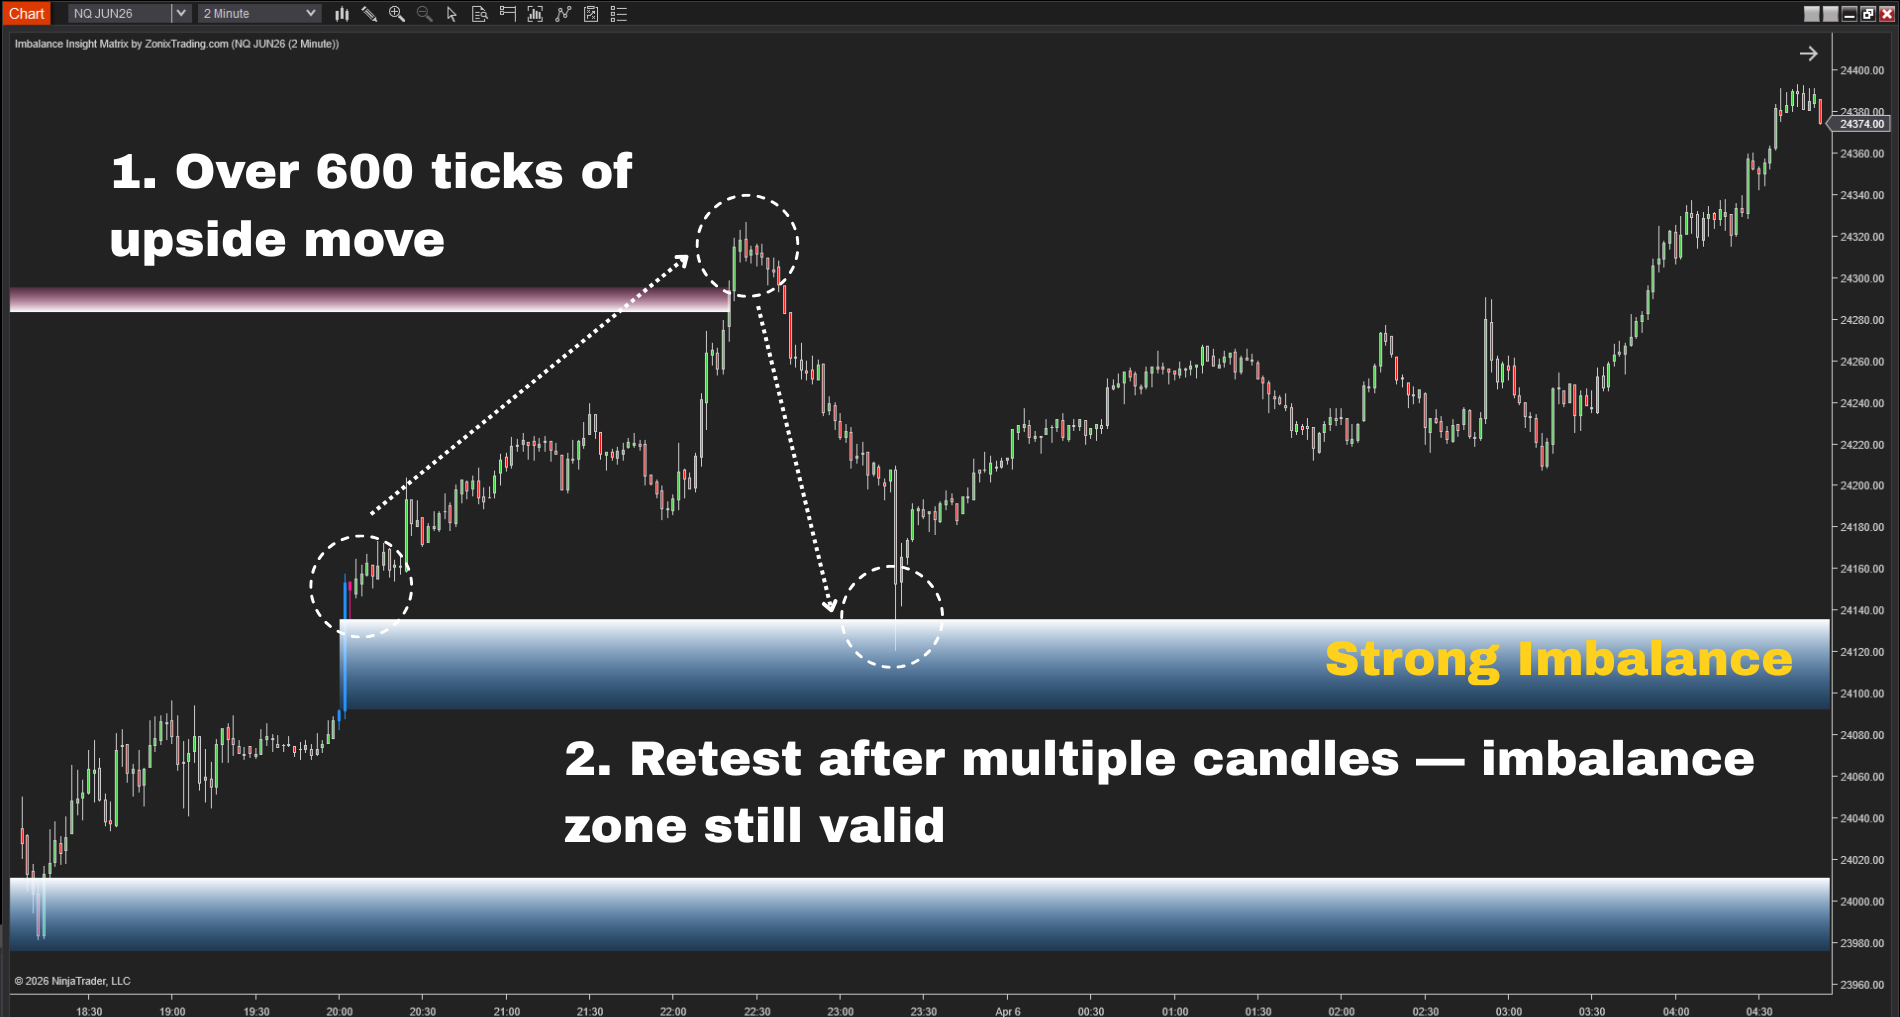
Every imbalance zone that appears must pass strict conditions:
- Price must move with real intent after the imbalance forms
→ at least N ticks to confirm real displacement, not just a weak push - Price must NOT return immediately
→ within the next N candles, showing one side is still in control - Overlapping imbalance zones are removed
→ keeping the chart clean and readable


Imbalance isn’t one-size-fits-all
The market doesn’t move in a fixed pattern — so neither does imbalance.
Some form during strong, one-sided moves. Others appear in more mixed, uneven price action.
Imbalance Insight Matrix adapts to both.
It can detect imbalance in different structures:
- Same-color candles → strong momentum, price moving in one direction
- Mixed candles → disruption in price flow, where movement becomes inefficient
So instead of forcing one definition, you’re seeing imbalance the way it actually forms.
When imbalance repeats, it reveals intent – that’s the edge
A single imbalance doesn’t always mean much. It can be:
- A temporary push
- A short reaction
- A move without real follow-through
If you look at them individually… you’ll often get noise.

But when imbalance repeats, it’s no longer random
When you start seeing multiple same-direction imbalances forming in the same area:
- Price is pushed repeatedly in one direction
- Liquidity is being targeted multiple times
- The market is clearly reacting to that zone
That’s not coincidence. That’s sustained participation from large players.
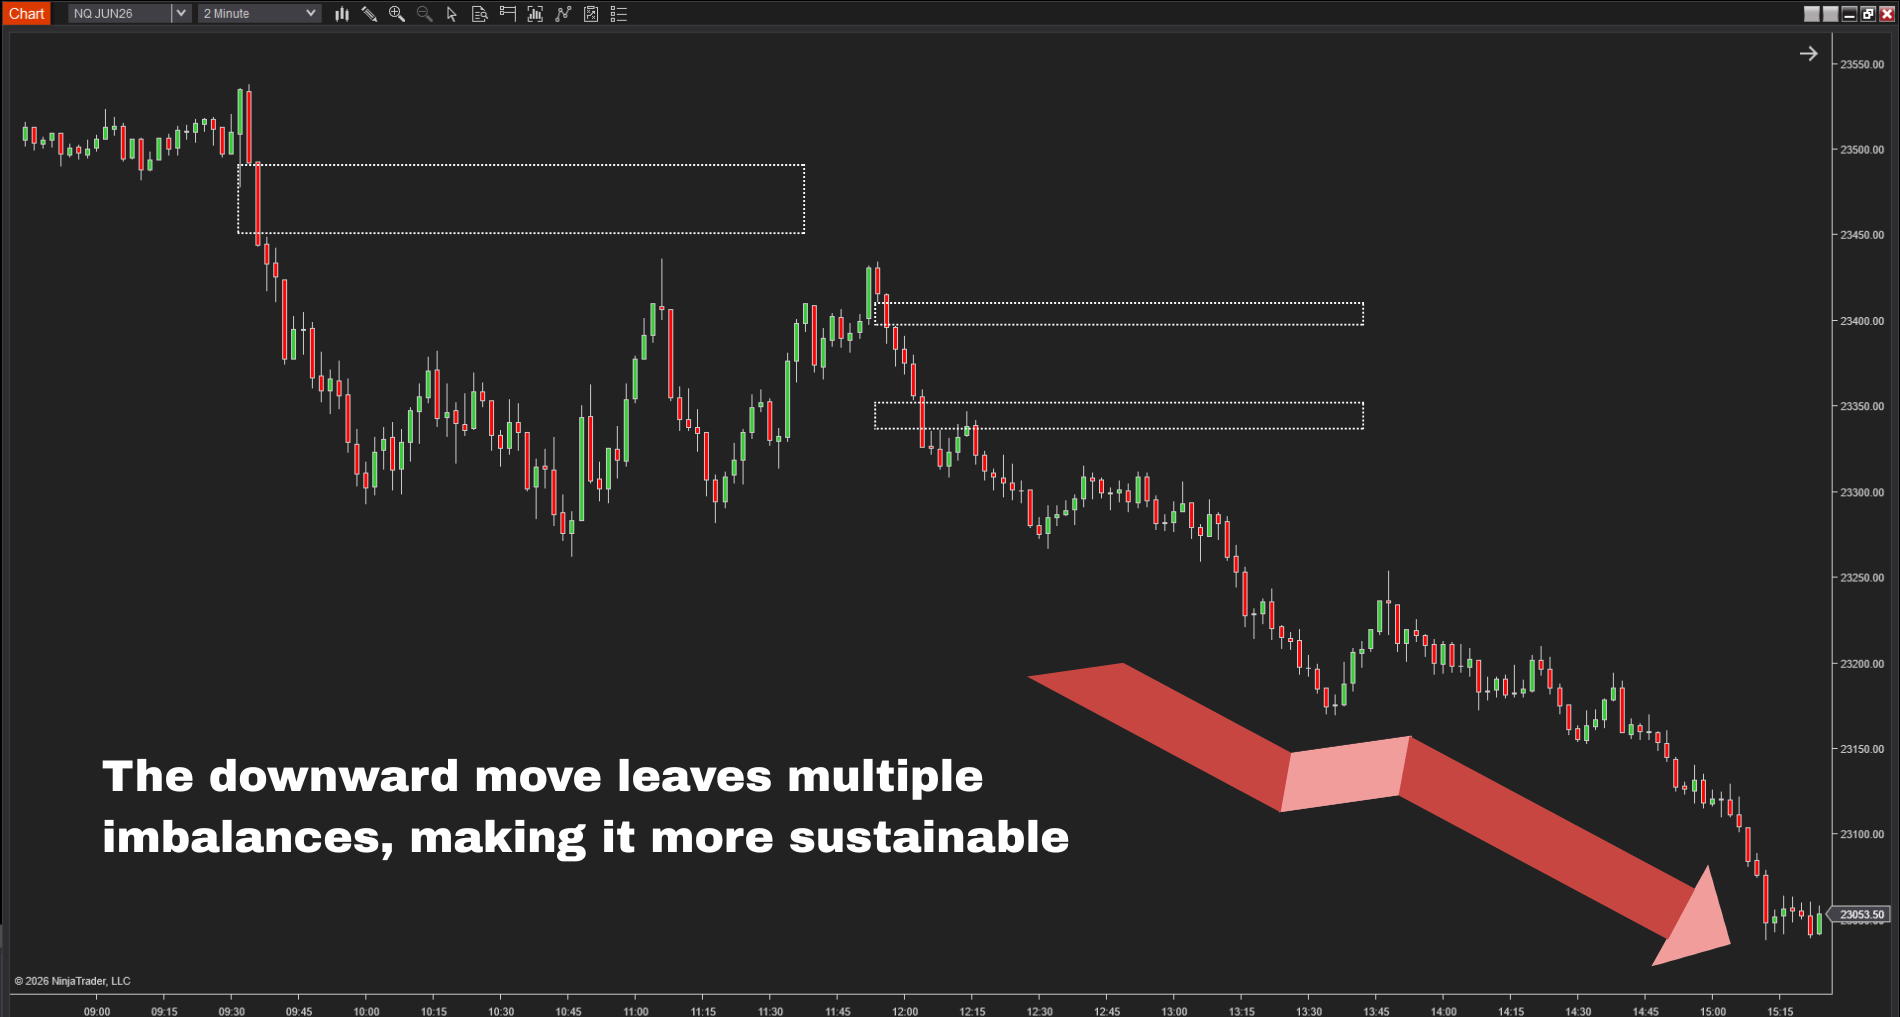
Multiple imbalance zones stack in one area — signalling repeated institutional activity.
Repeated imbalance becomes one clear zone
Instead of leaving you with multiple clustered zones, Imbalance Insight Matrix automatically merges them into a single cluster zone.
(You can enable or disable this feature anytime.)

Clustered imbalance zones merge into one key area – stronger, clearer, more reliable.
Every cluster zone must meet its own conditions:
- After the cluster forms, price must move at least N ticks → confirming real continuation, not just random stacking.
- If there’s no follow-through, the cluster doesn’t hold up.
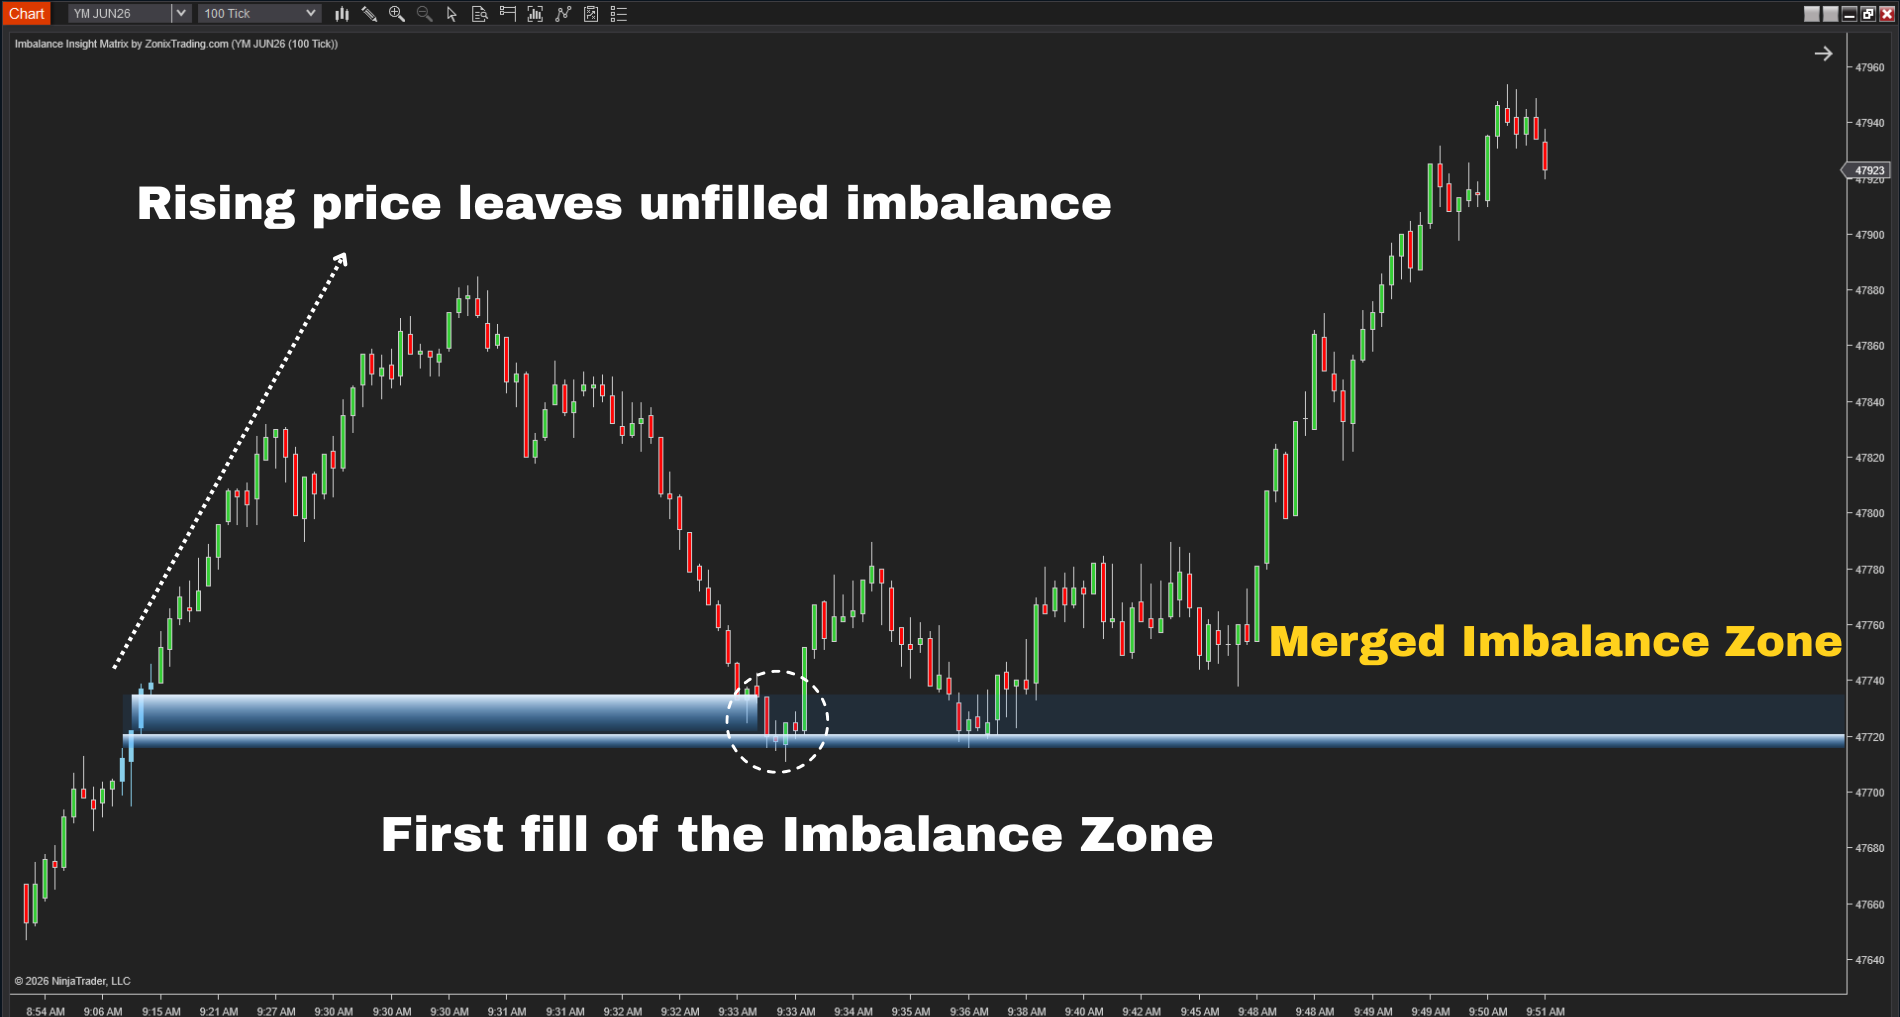
So instead of dozens of small, disconnected areas, you get:
- A single, unified zone
- Stronger confluence
- A clearer area to observe and trade

How identifying Imbalance zones improves your trading strategy
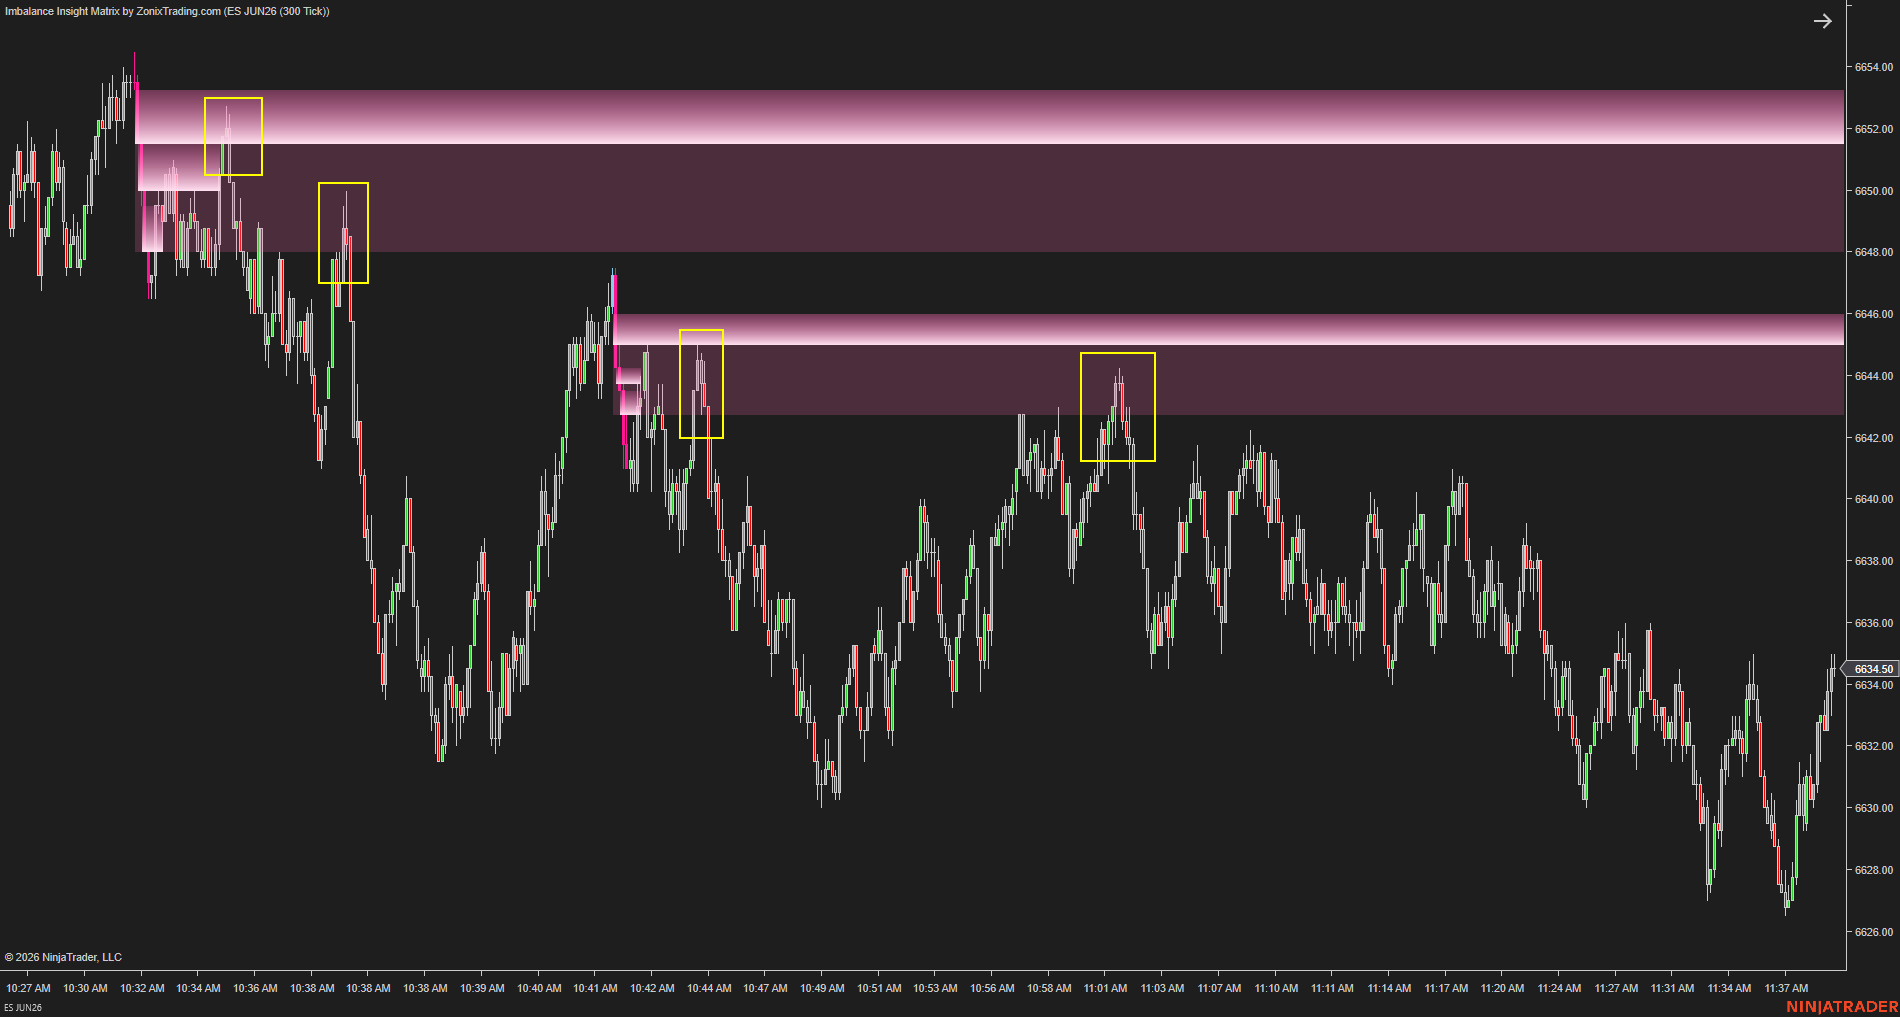
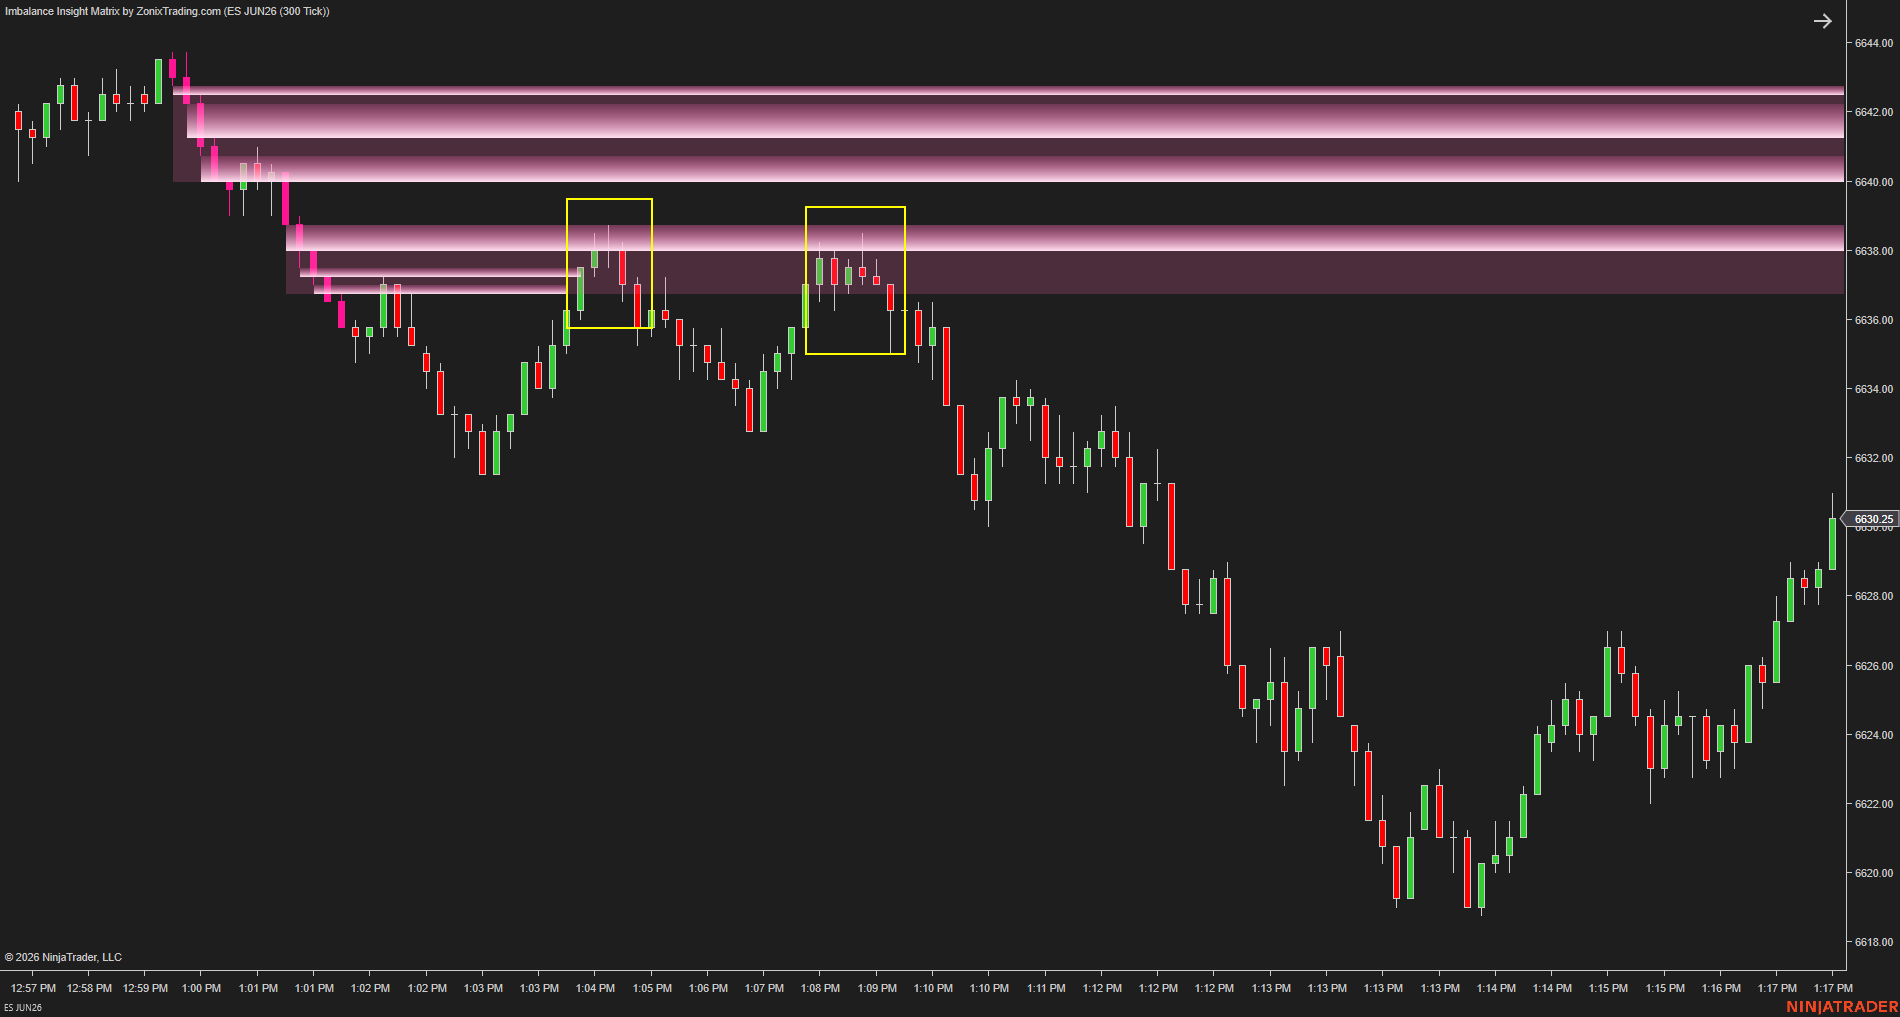

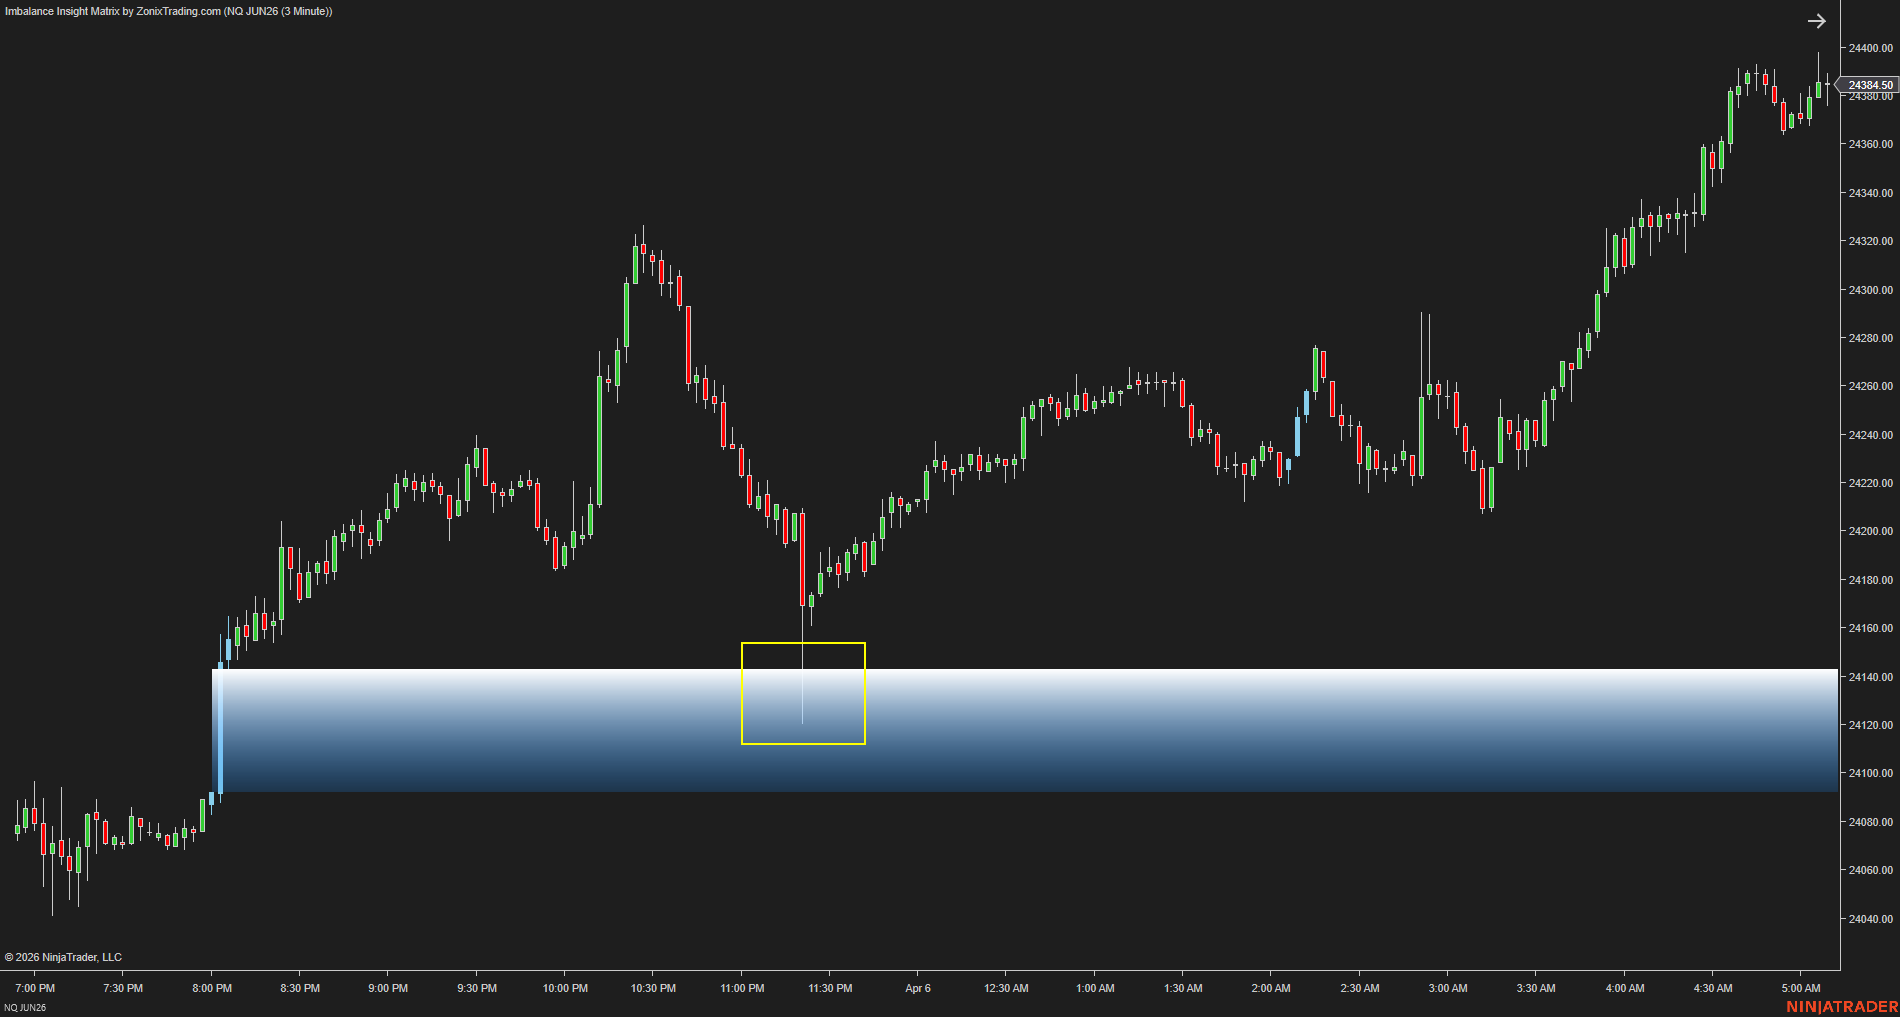

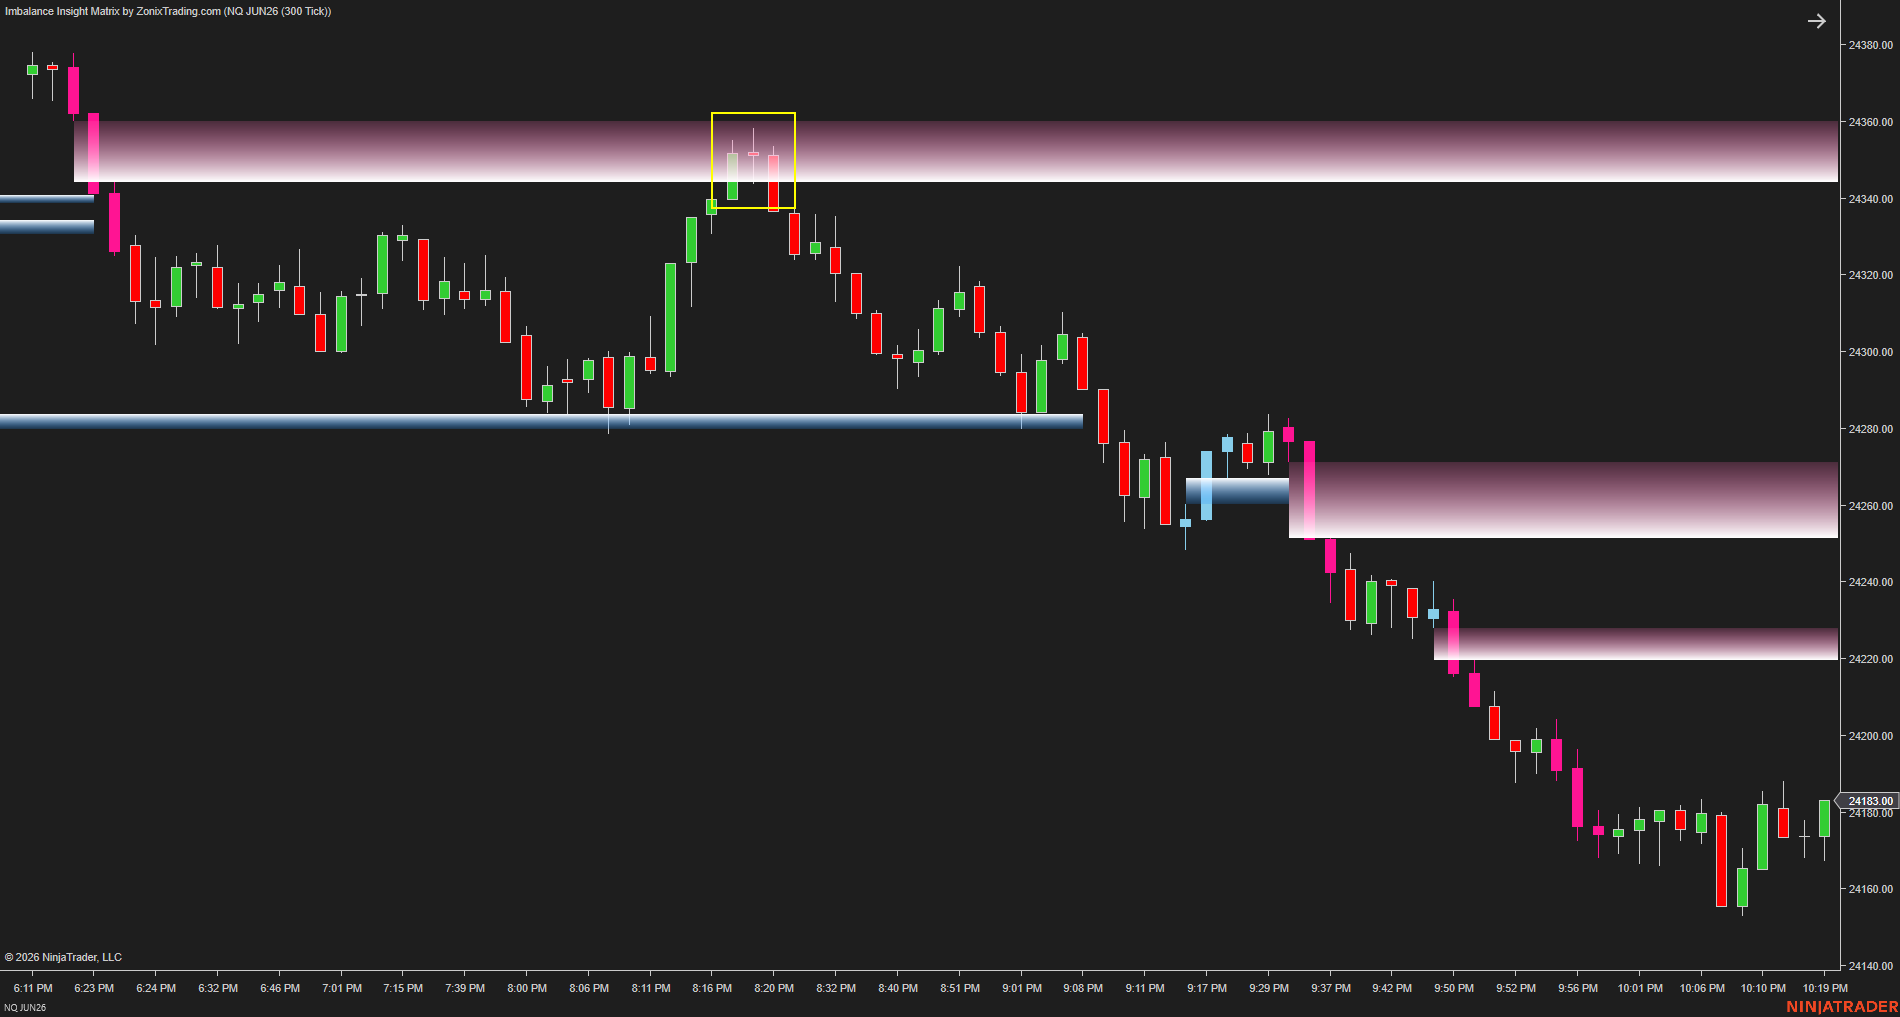
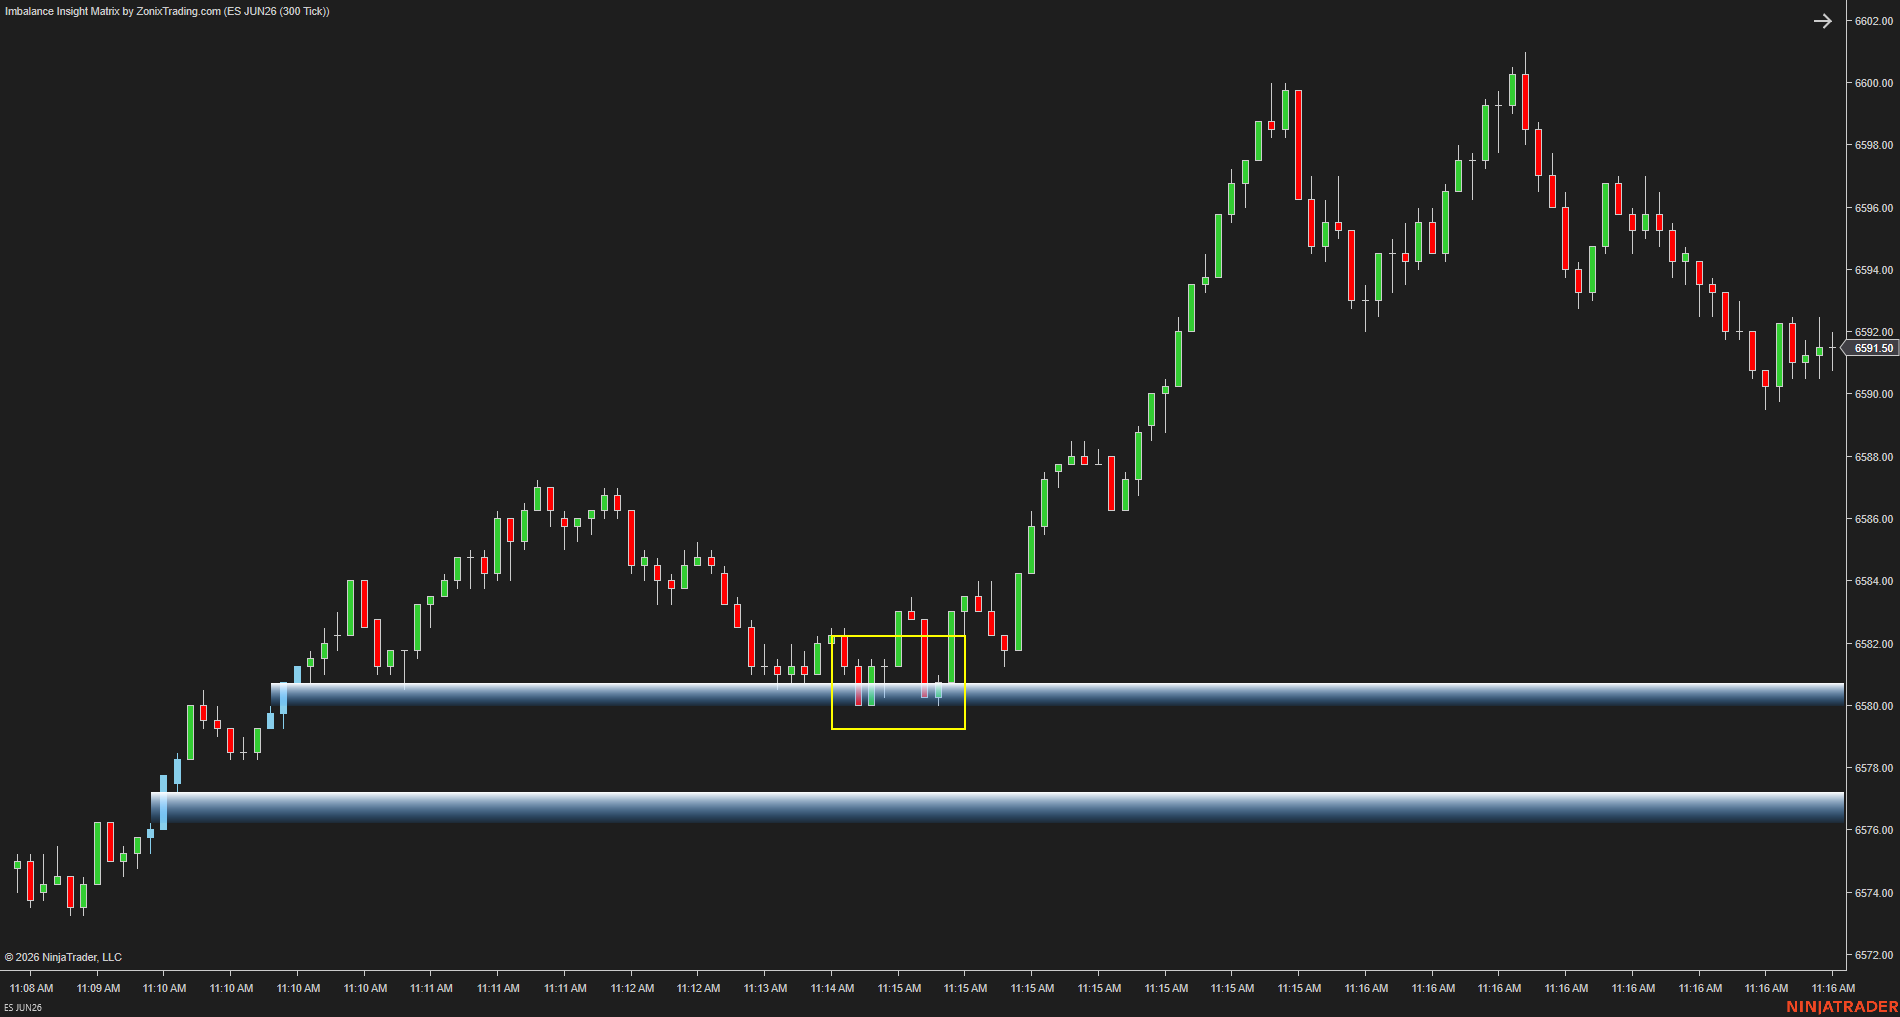
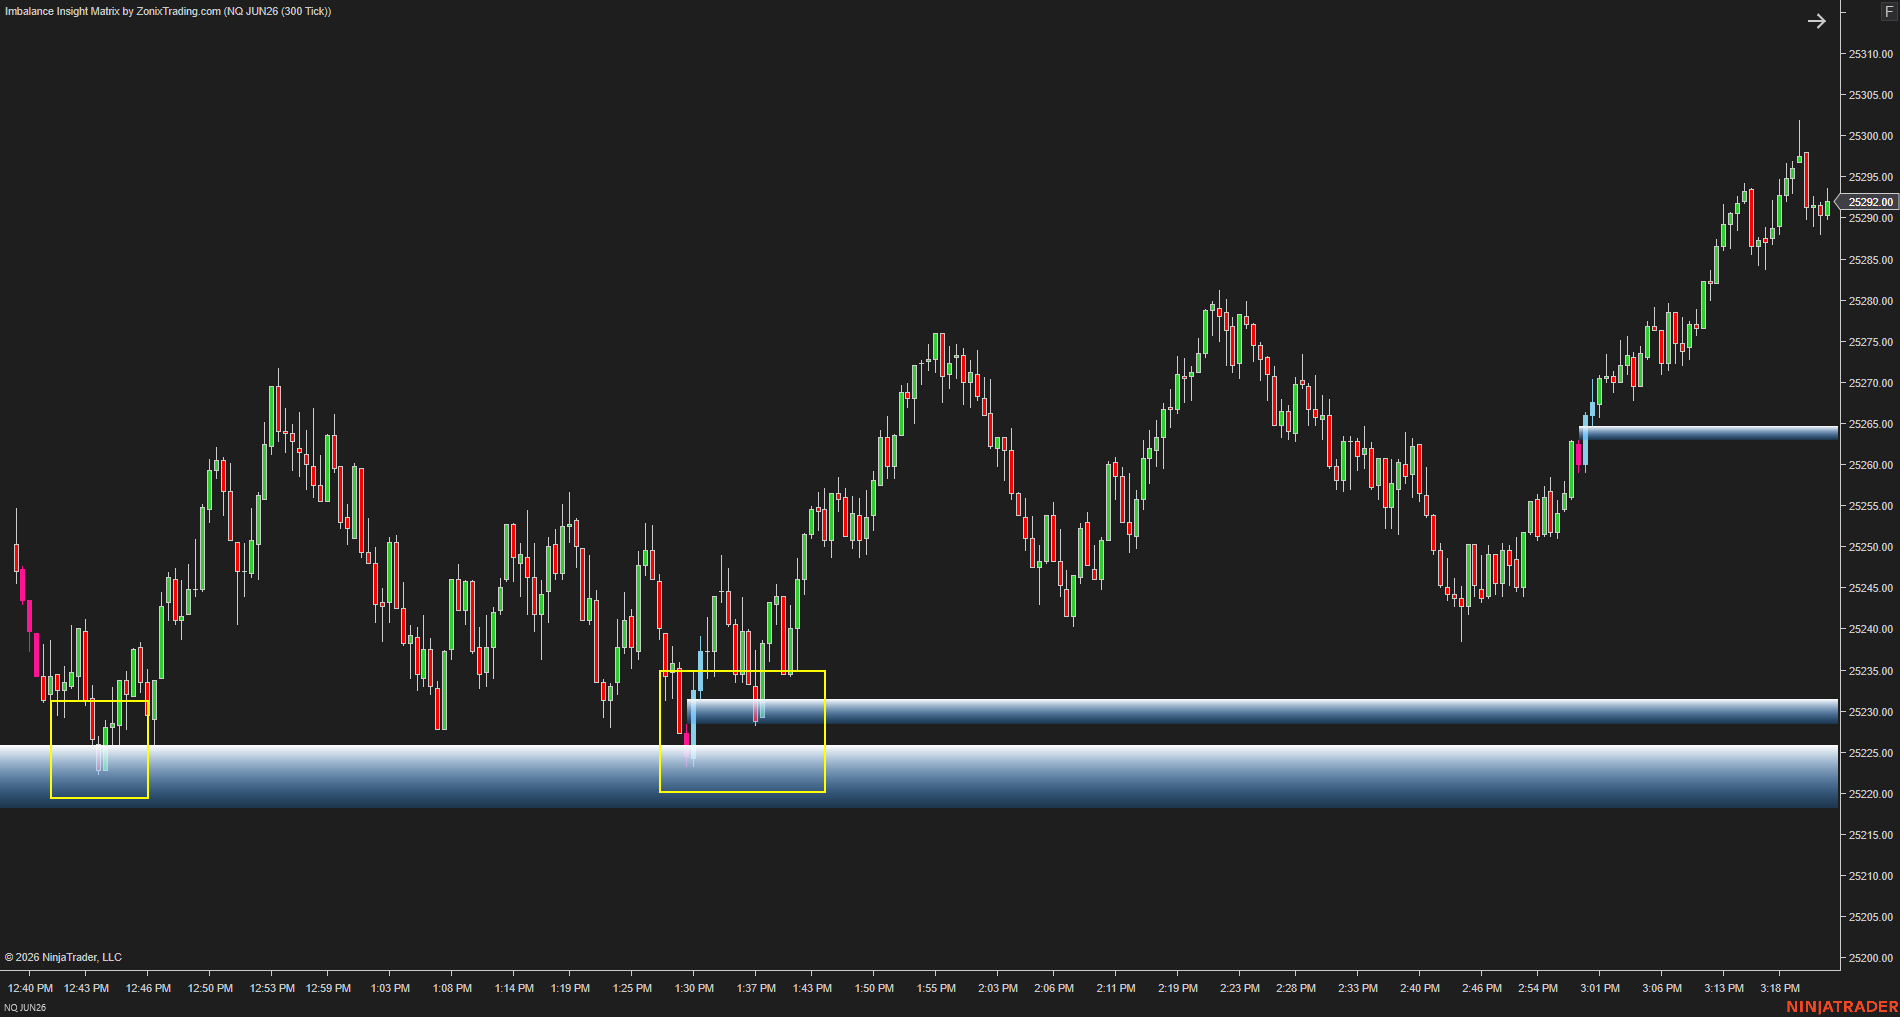
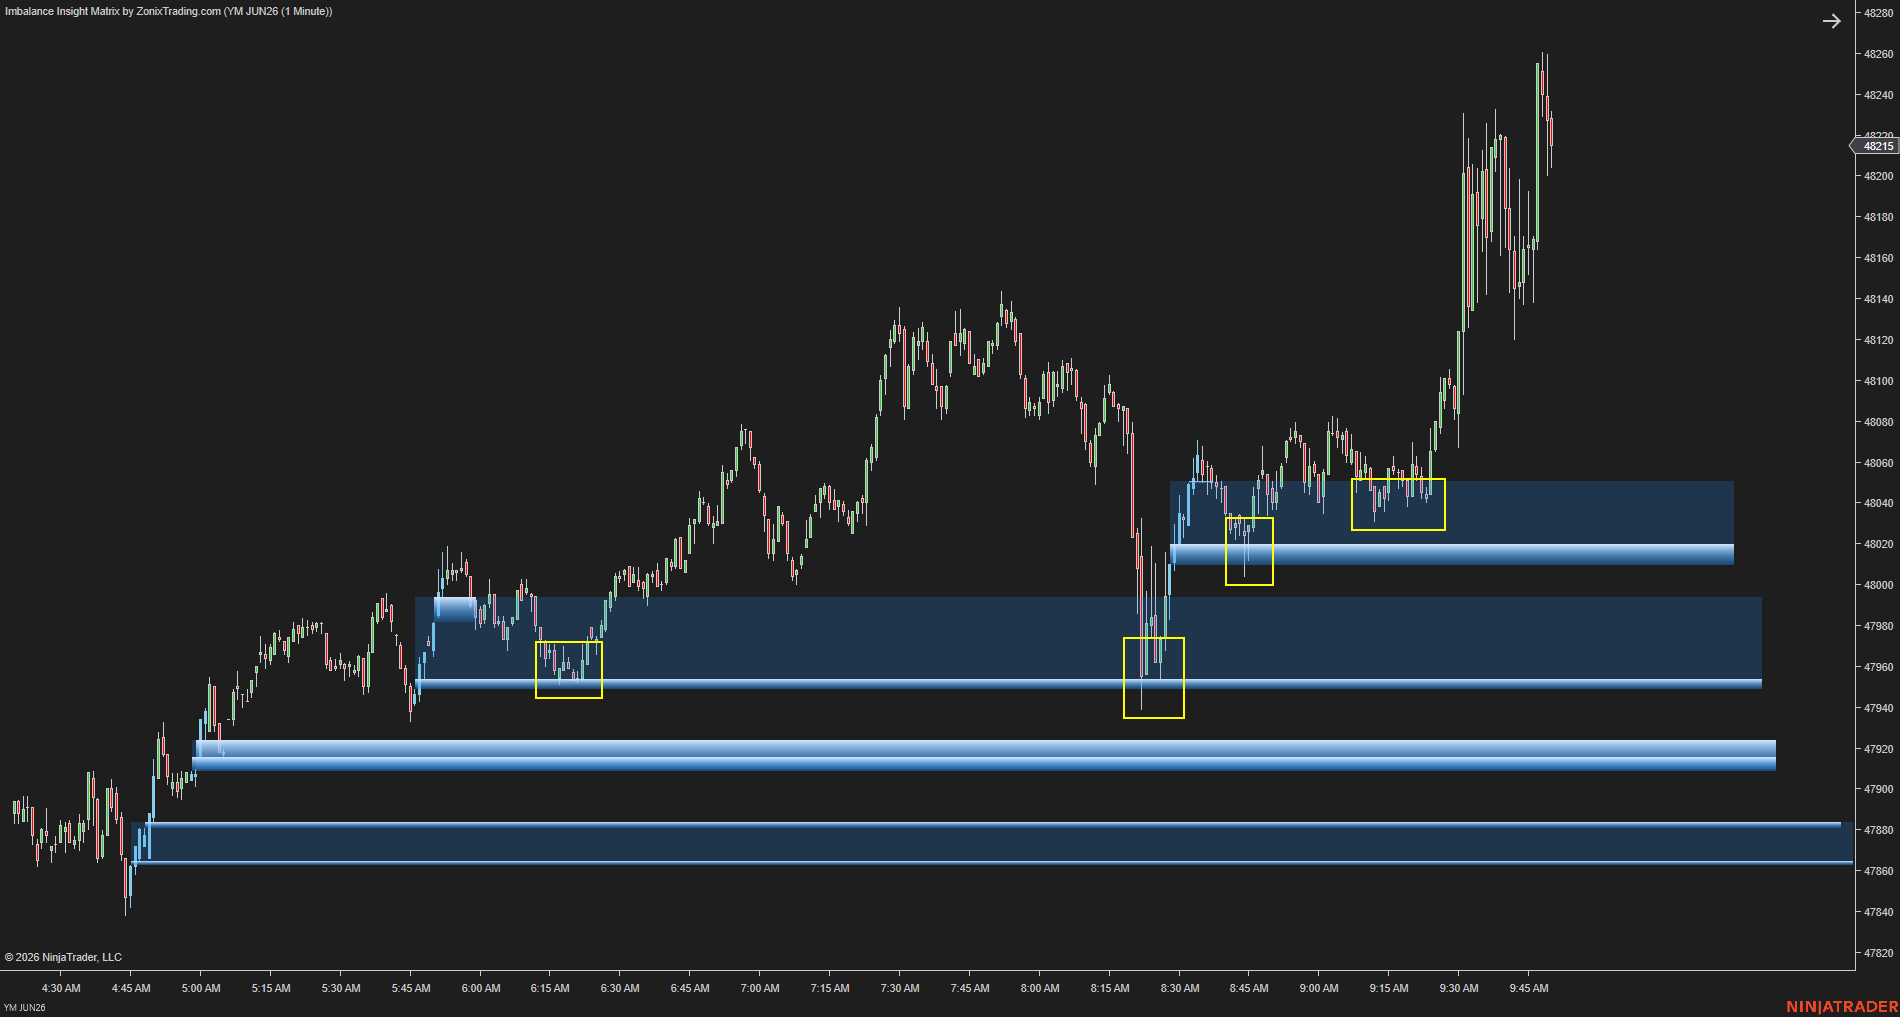


See Imbalance Insight Matrix filter high-probability zones LIVE
In this video, Harry explains a strategy using merged imbalance zones to spot high-probability trades. He demonstrates real-time trading, executing 6 successful trades without being stopped out.
What Traders usually ask
Special price for YOU during the new launch phase
| Option 1: Core Access | Option 2: Enhanced Setup (Best Value) | Option 3: Complete Trading Suite |
| Imbalance Insight Matrix Everything you need to filter and trade high-quality imbalance zones. Original value: $550 → But for today: $275 ✔ Smart imbalance filtering ✔ Clean, validated zones ✔ Built for real execution | Imbalance Insight Matrix + Romantick Pulse Add momentum confirmation to your imbalance zones and get additional value for future upgrades. Original value: $1,450 → But for today: $450 ✔ Better timing with momentum insight ✔ Stronger confirmation for entries | Imbalance Insight Matrix + Romantick Pulse + Captain Optimus Strong A full-stack system designed for structure, momentum, and execution – with maximum added value. Original value: $3,650 → But for today: $1,100 ✔ Full confluence across multiple tools ✔ Designed for deeper market understanding |
Test the indicators in real market conditions for 30 days…
If it’s not working for you, simply switch to another indicator via our Zuture Exchange policy, with little to no extra cost.
Start Seeing What Actually Matters on Your Chart

Stop reacting to every imbalance.
Start focusing on the ones that truly count.