3 pro-grade trading products – for less than the price of one
1 indicator. 2 bars. Each one built to strengthen your setup.
Individually priced at a premium – now available together at an exceptional value, for a limited time.

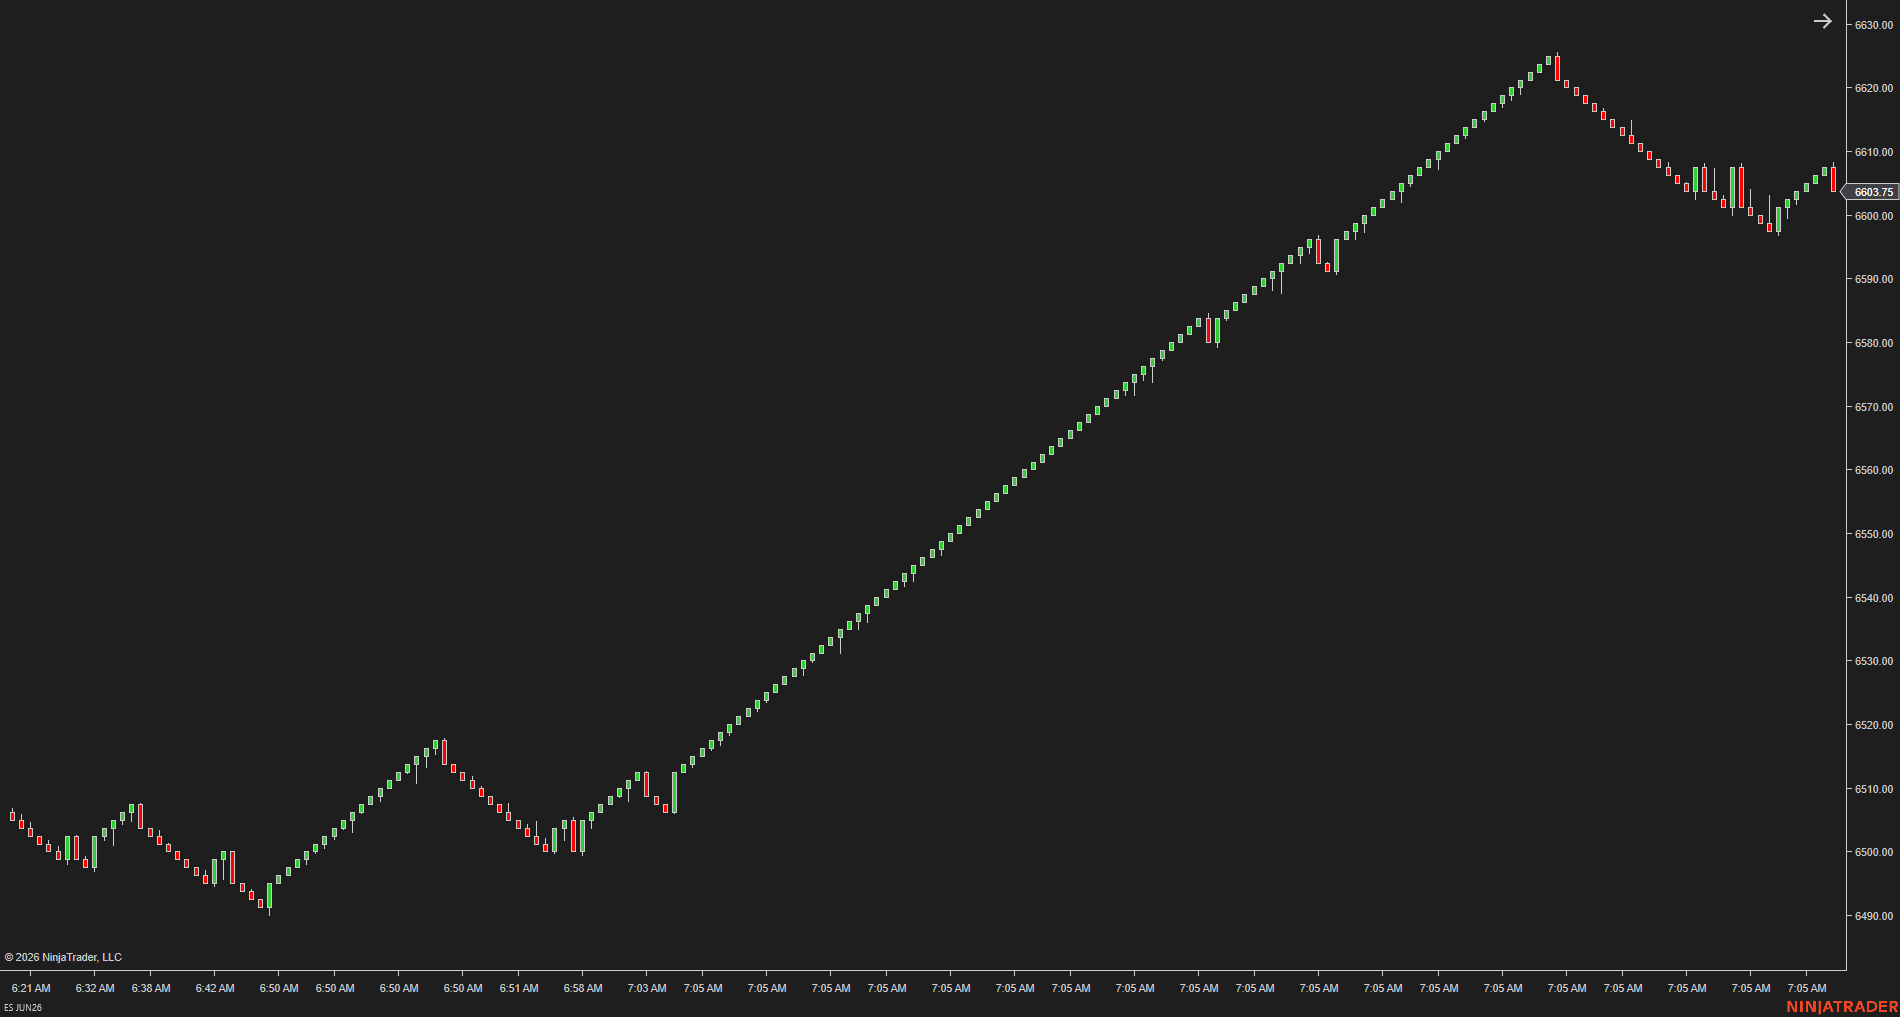
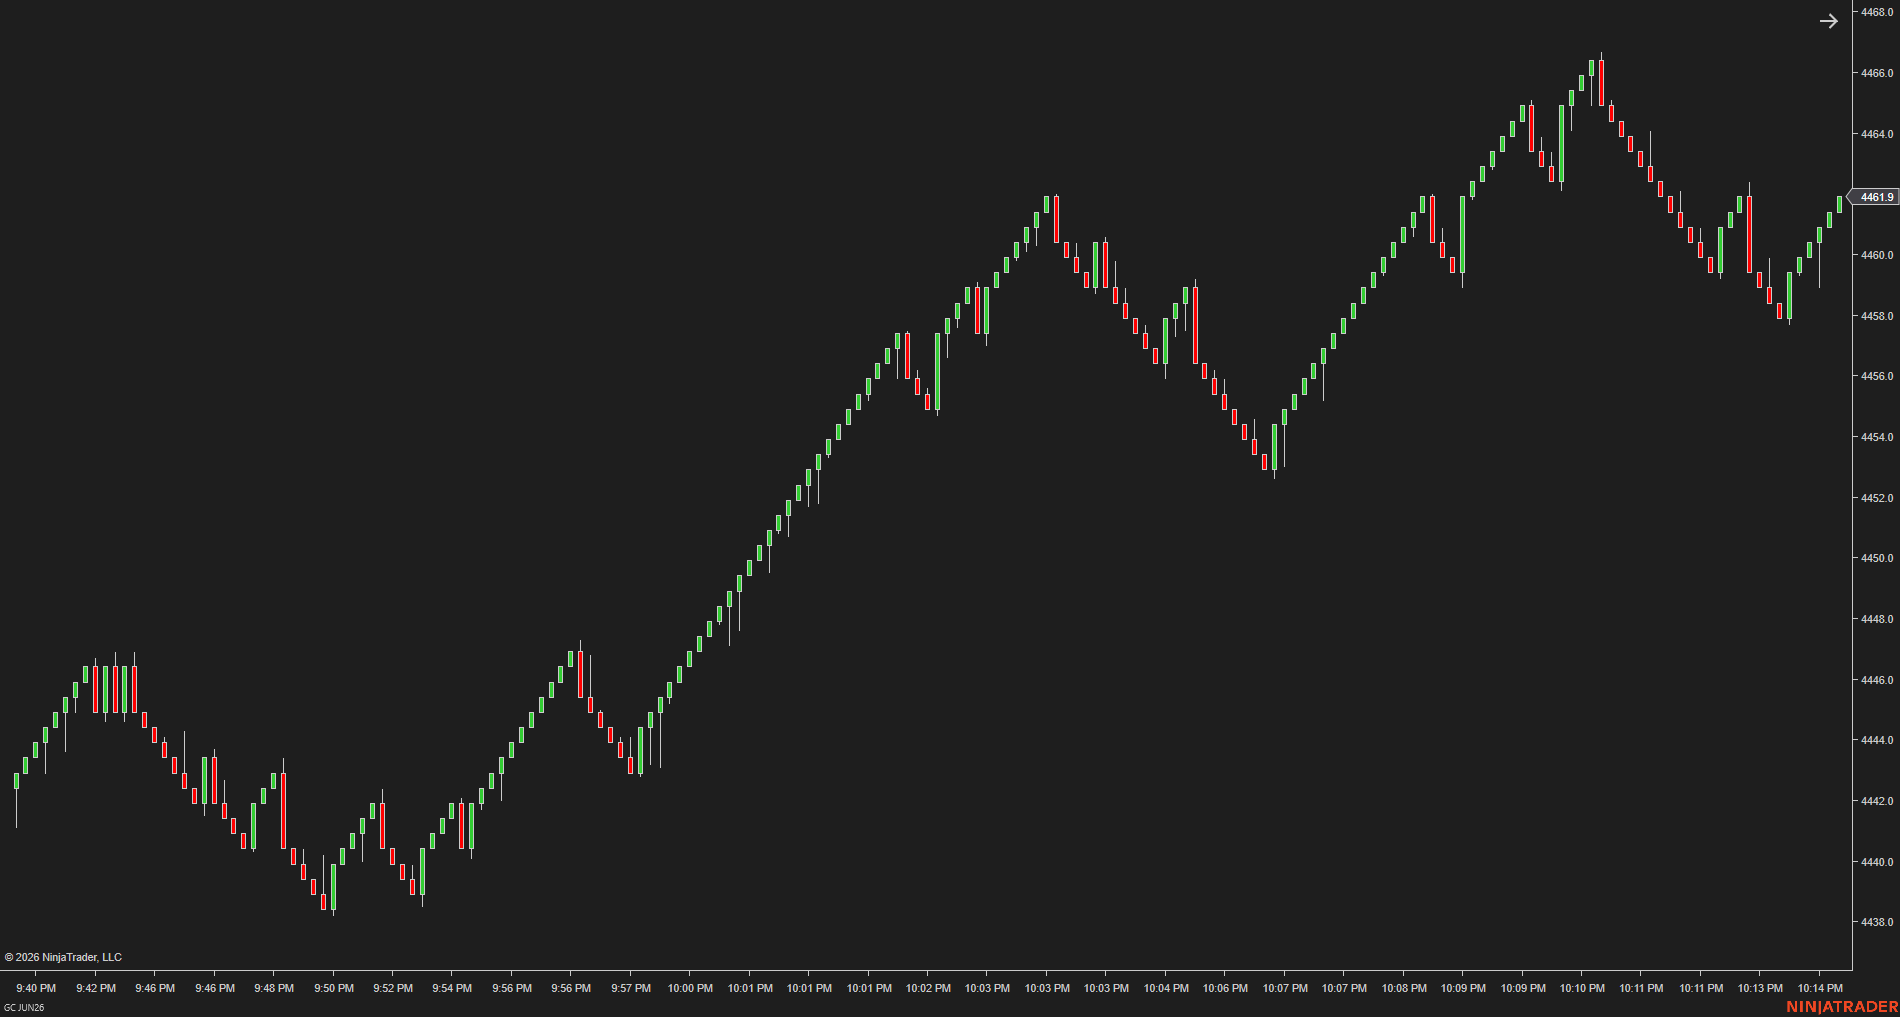
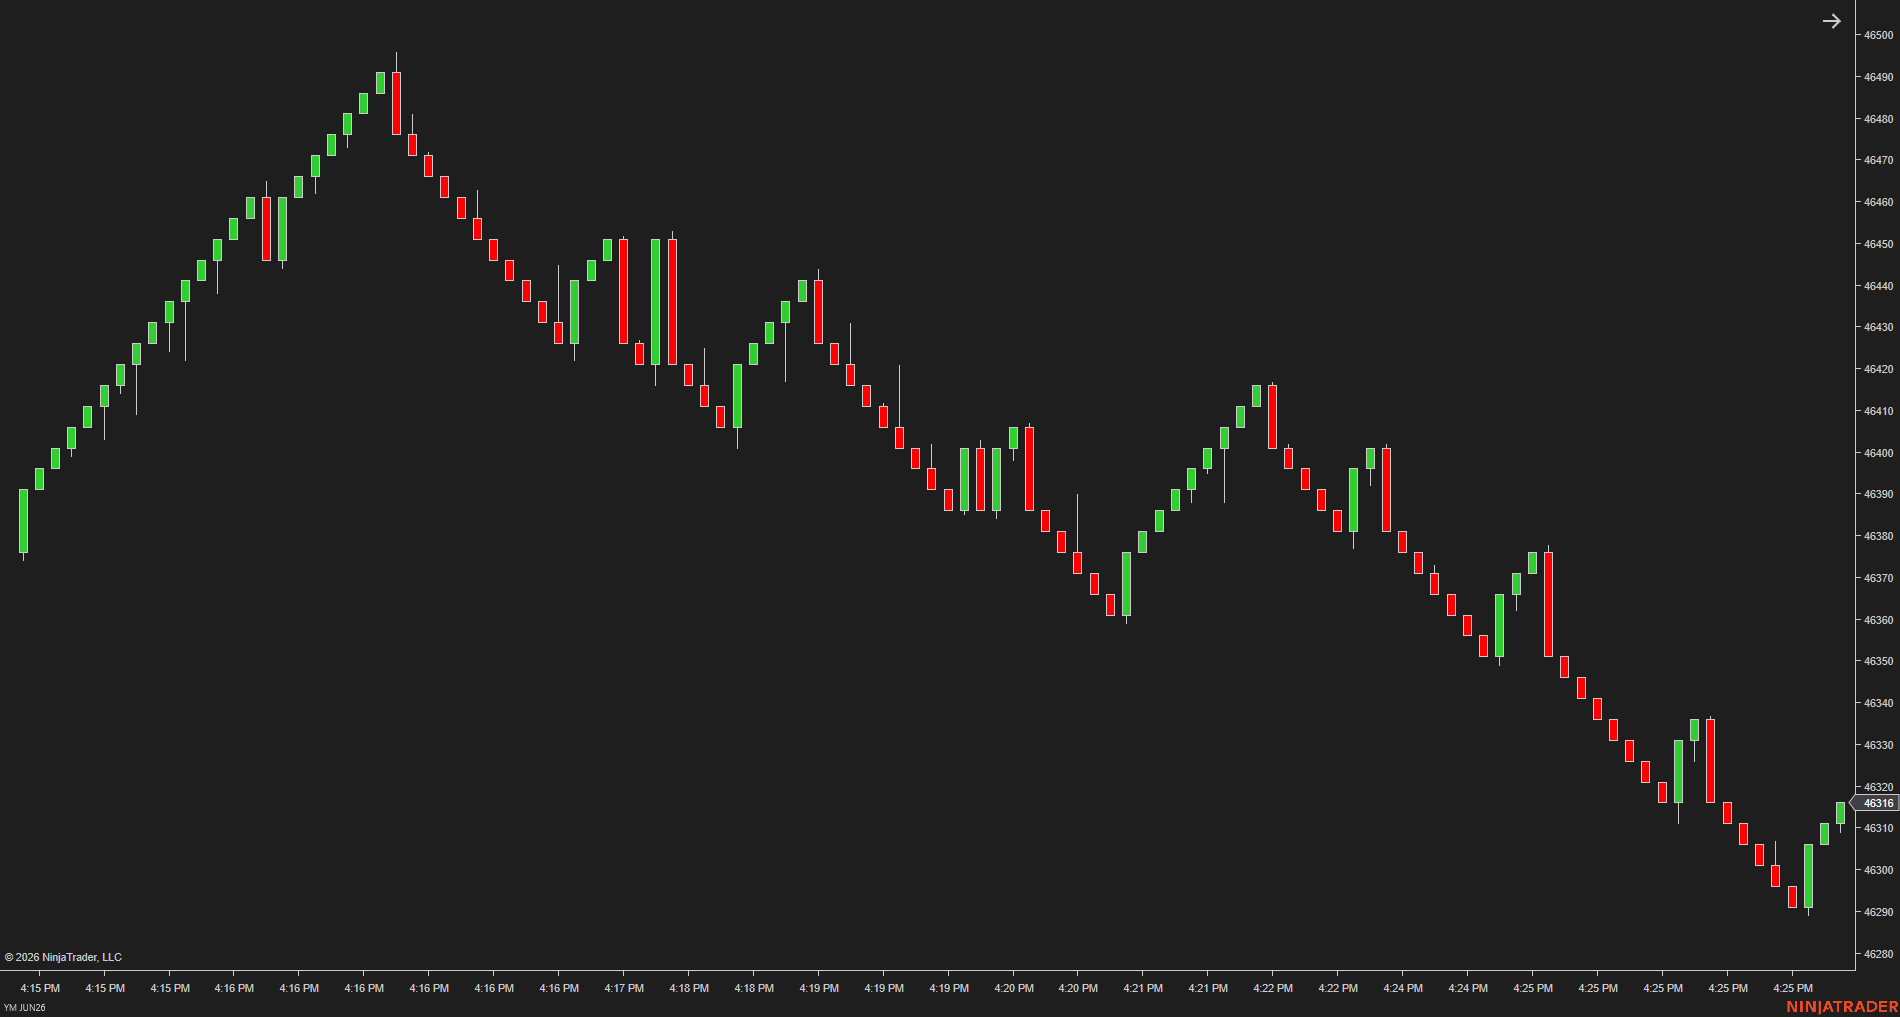
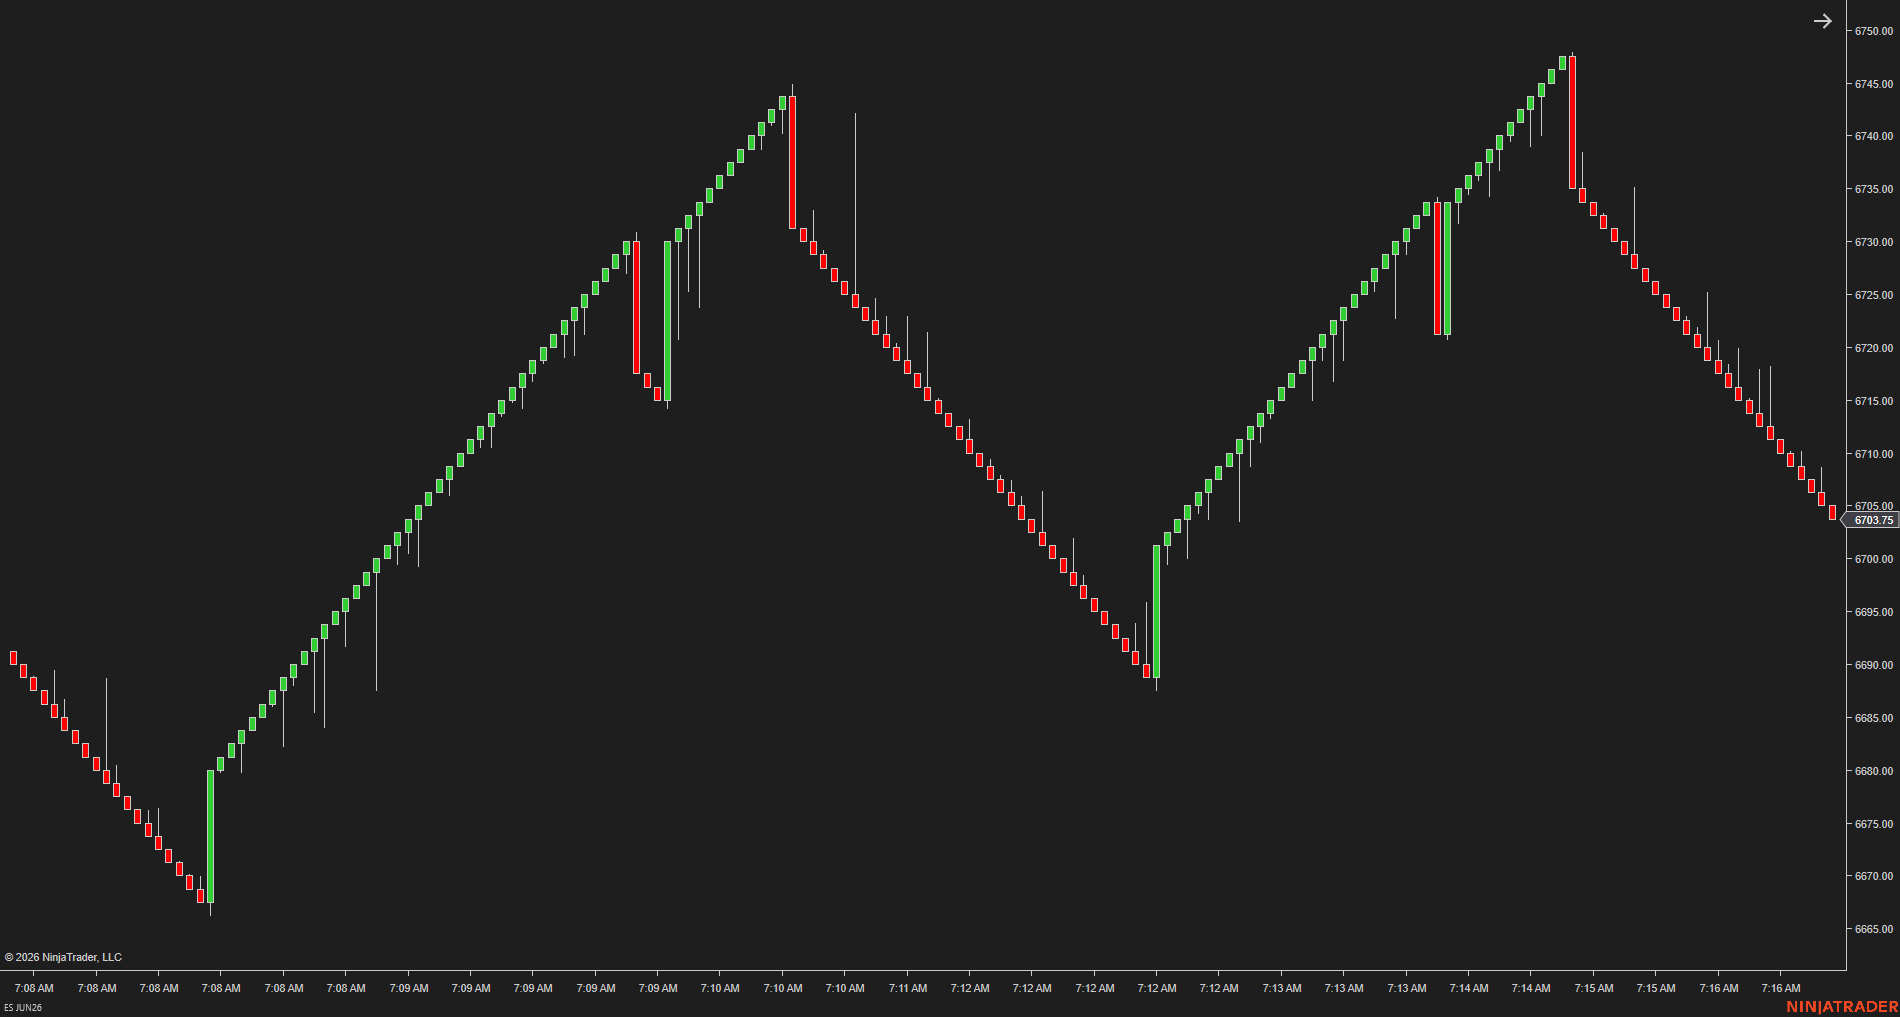
See where the market accepts price – not just where it moves
Read trends more clearly – and confirm reversals more strictly
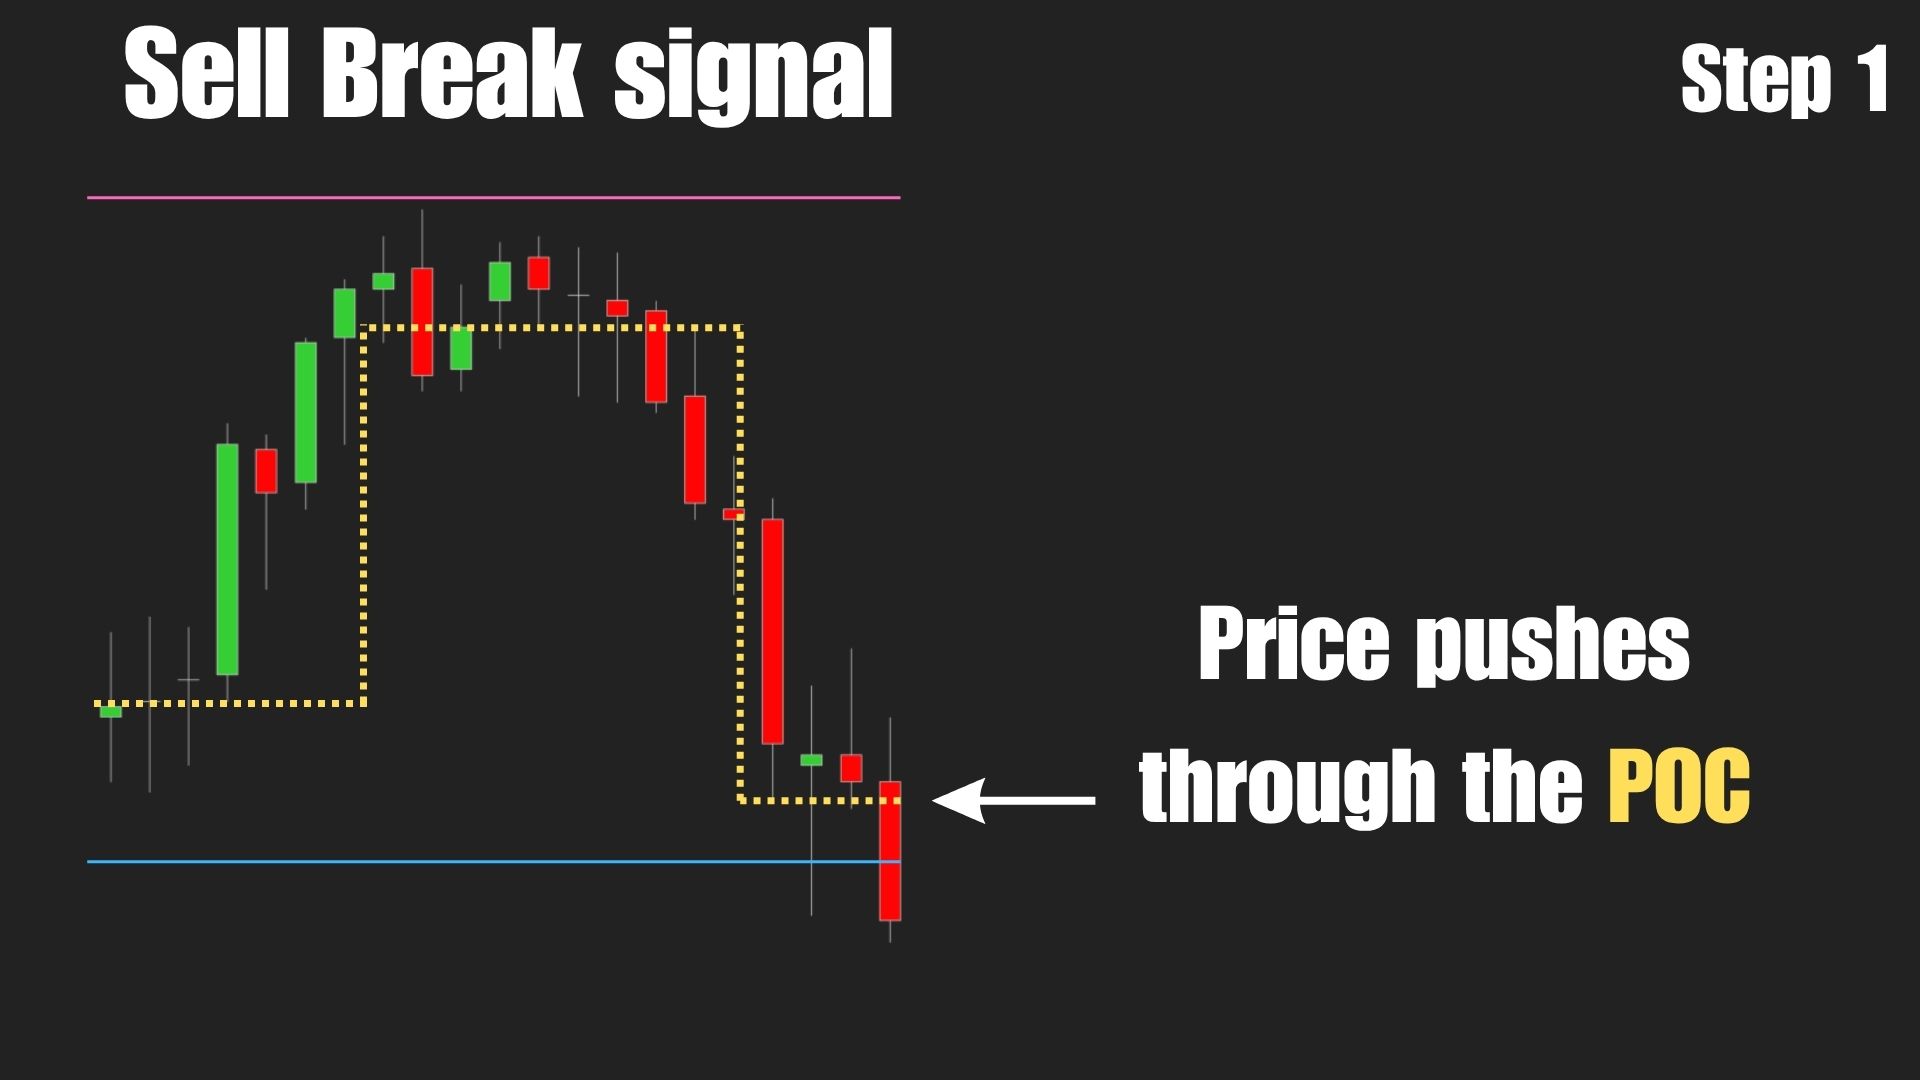
Wait for structure to break – don’t react to reversals
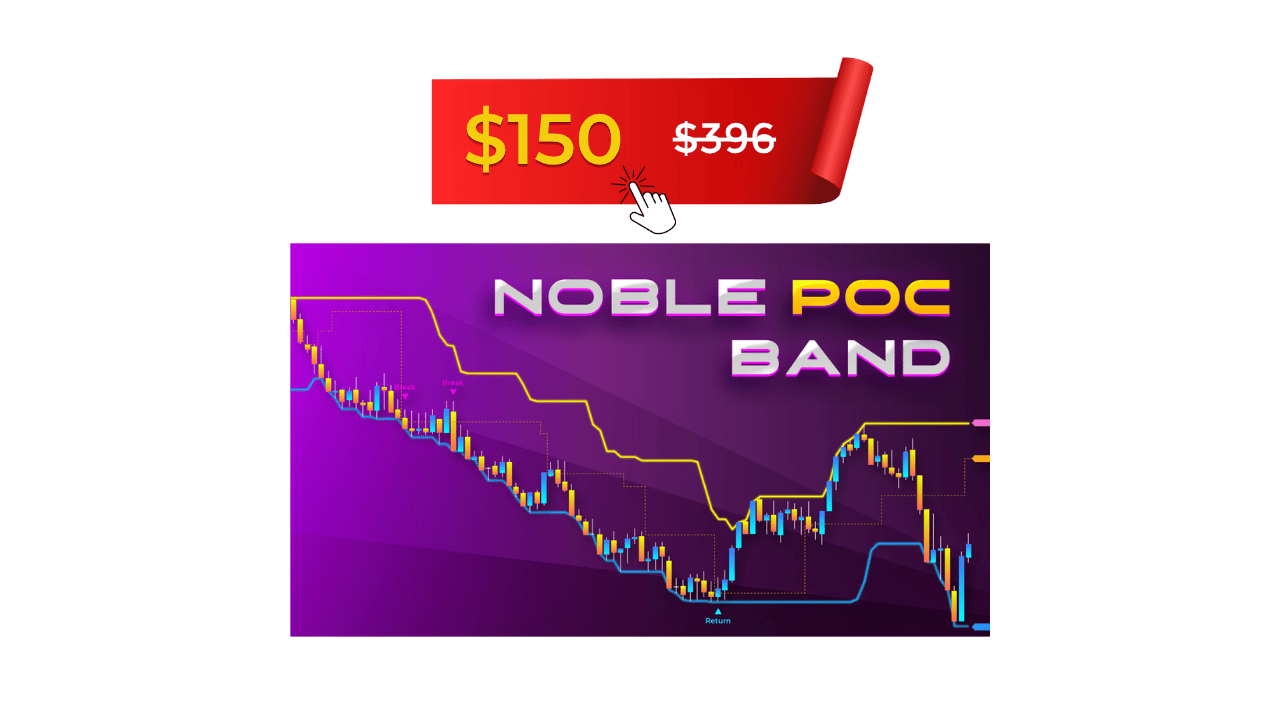
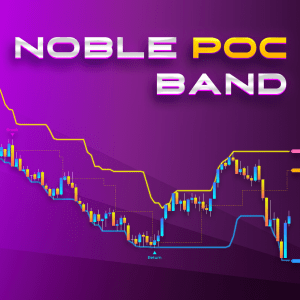
1. Noble POC Band
Are you trading price… or trading where the market actually cares?
If you’ve been trading for a while, you’ve likely seen this.
You read the direction right, wait for a clean breakout, see strong momentum – and enter.
Price reverses, takes your stop… then later moves exactly where you expected.
This isn’t a direction problem. It’s timing.
More precisely: You entered a price the market hasn’t accepted yet.
Most tools show movement. They don’t show acceptance.
Bollinger Bands, Keltner Channels… they’re built on price. They show:
- volatility expanding or contracting
- momentum getting stronger or weaker
That’s useful.
But it doesn’t answer 1 key question:
Will the market actually stay at this price?
Price can move without being accepted.
You’ve seen it – price breaks out, looks clean, pulls traders in, then drops right back.
Not because the move was wrong – but because there wasn’t enough trading interest to hold it there.
What actually matters is not just where price is going, but where trading is happening, where value is forming, and where price holds – or gets rejected.
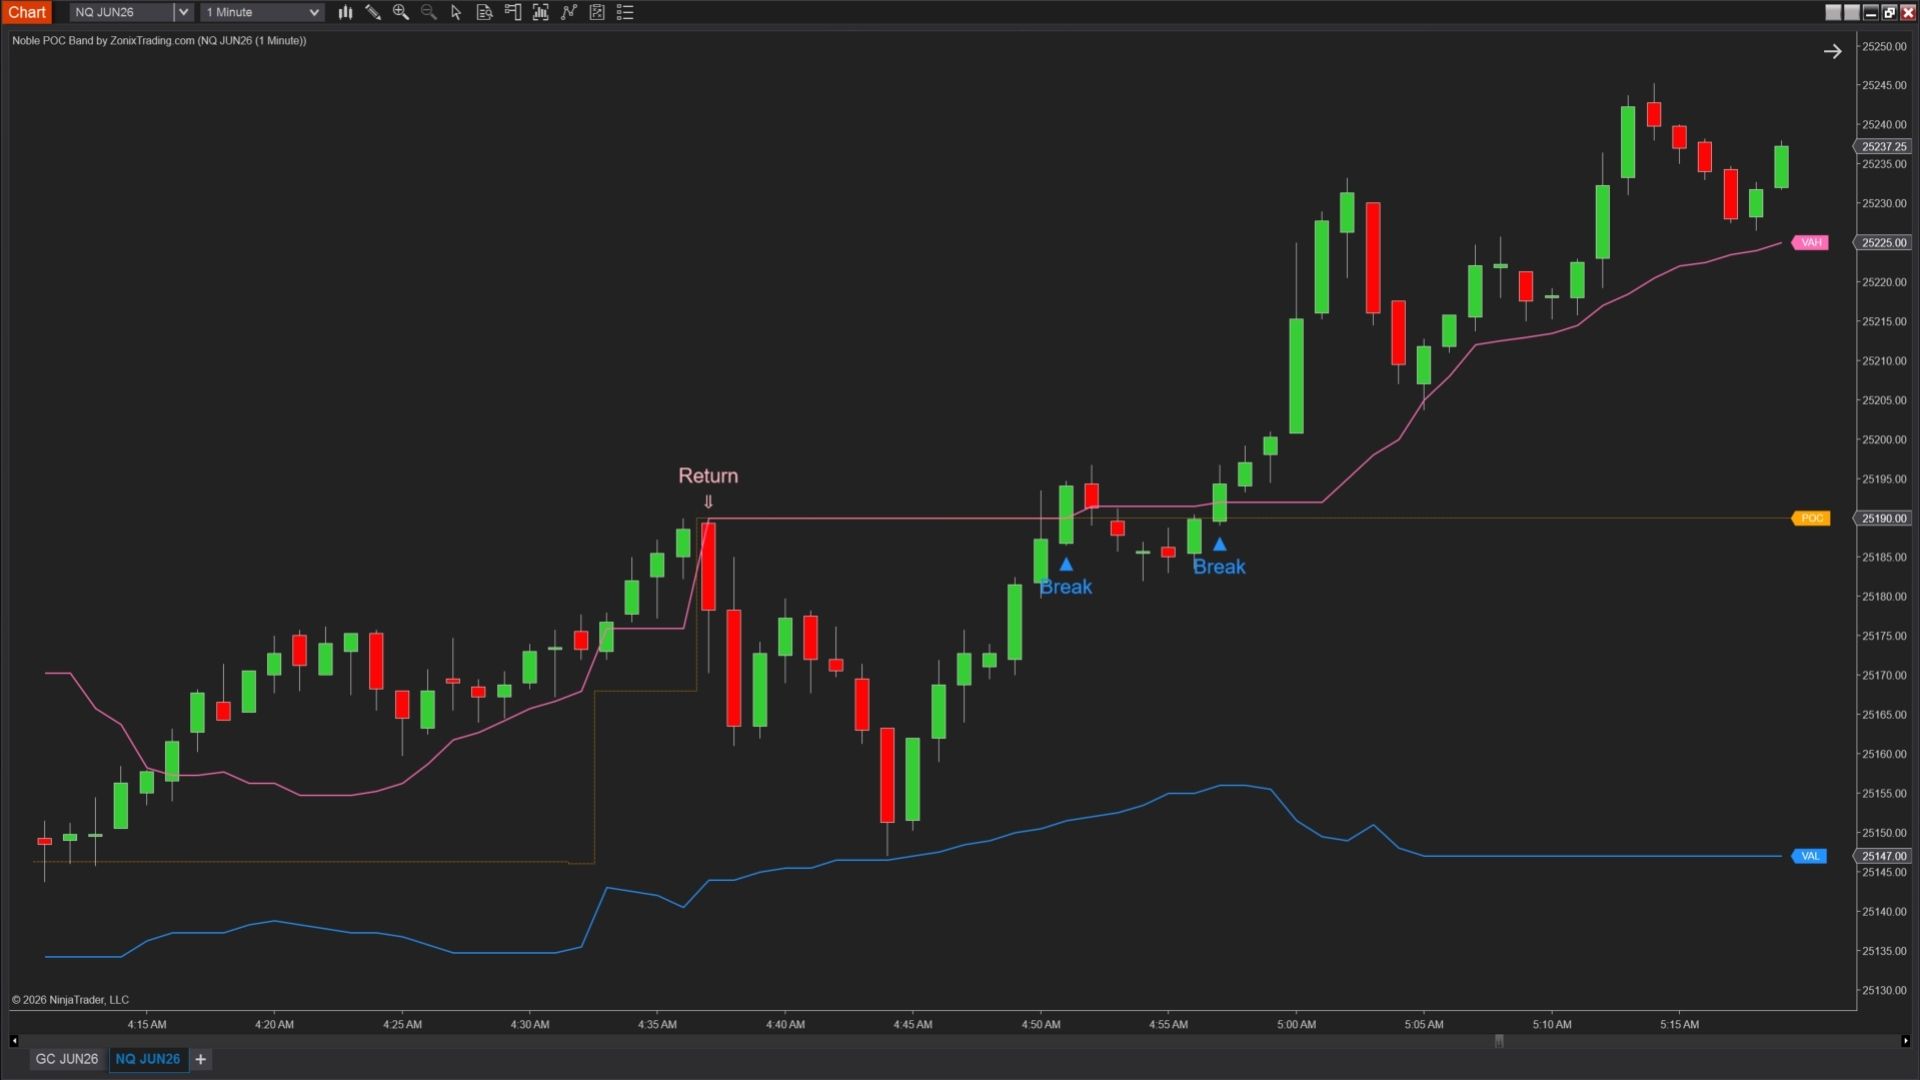
Noble POC Band shows exactly that

Defining value through activity
Instead of building bands from price, it’s built from trading activity:
- POC – where the most volume is traded
- VAH – the upper boundary of the fair value area, representing the highest price level within the range where the market is actively accepting trades.
- VAL – the lower boundary of the fair value area, representing the lowest price level within the range where the market is actively accepting trades
Together, they define a real value zone.
How to read it
- When price is inside the zone → market is balanced
- When price moves outside → market is testing new prices
What matters next
- Holds outside → accepted → continuation more likely
- Returns inside → rejected → move likely to fail


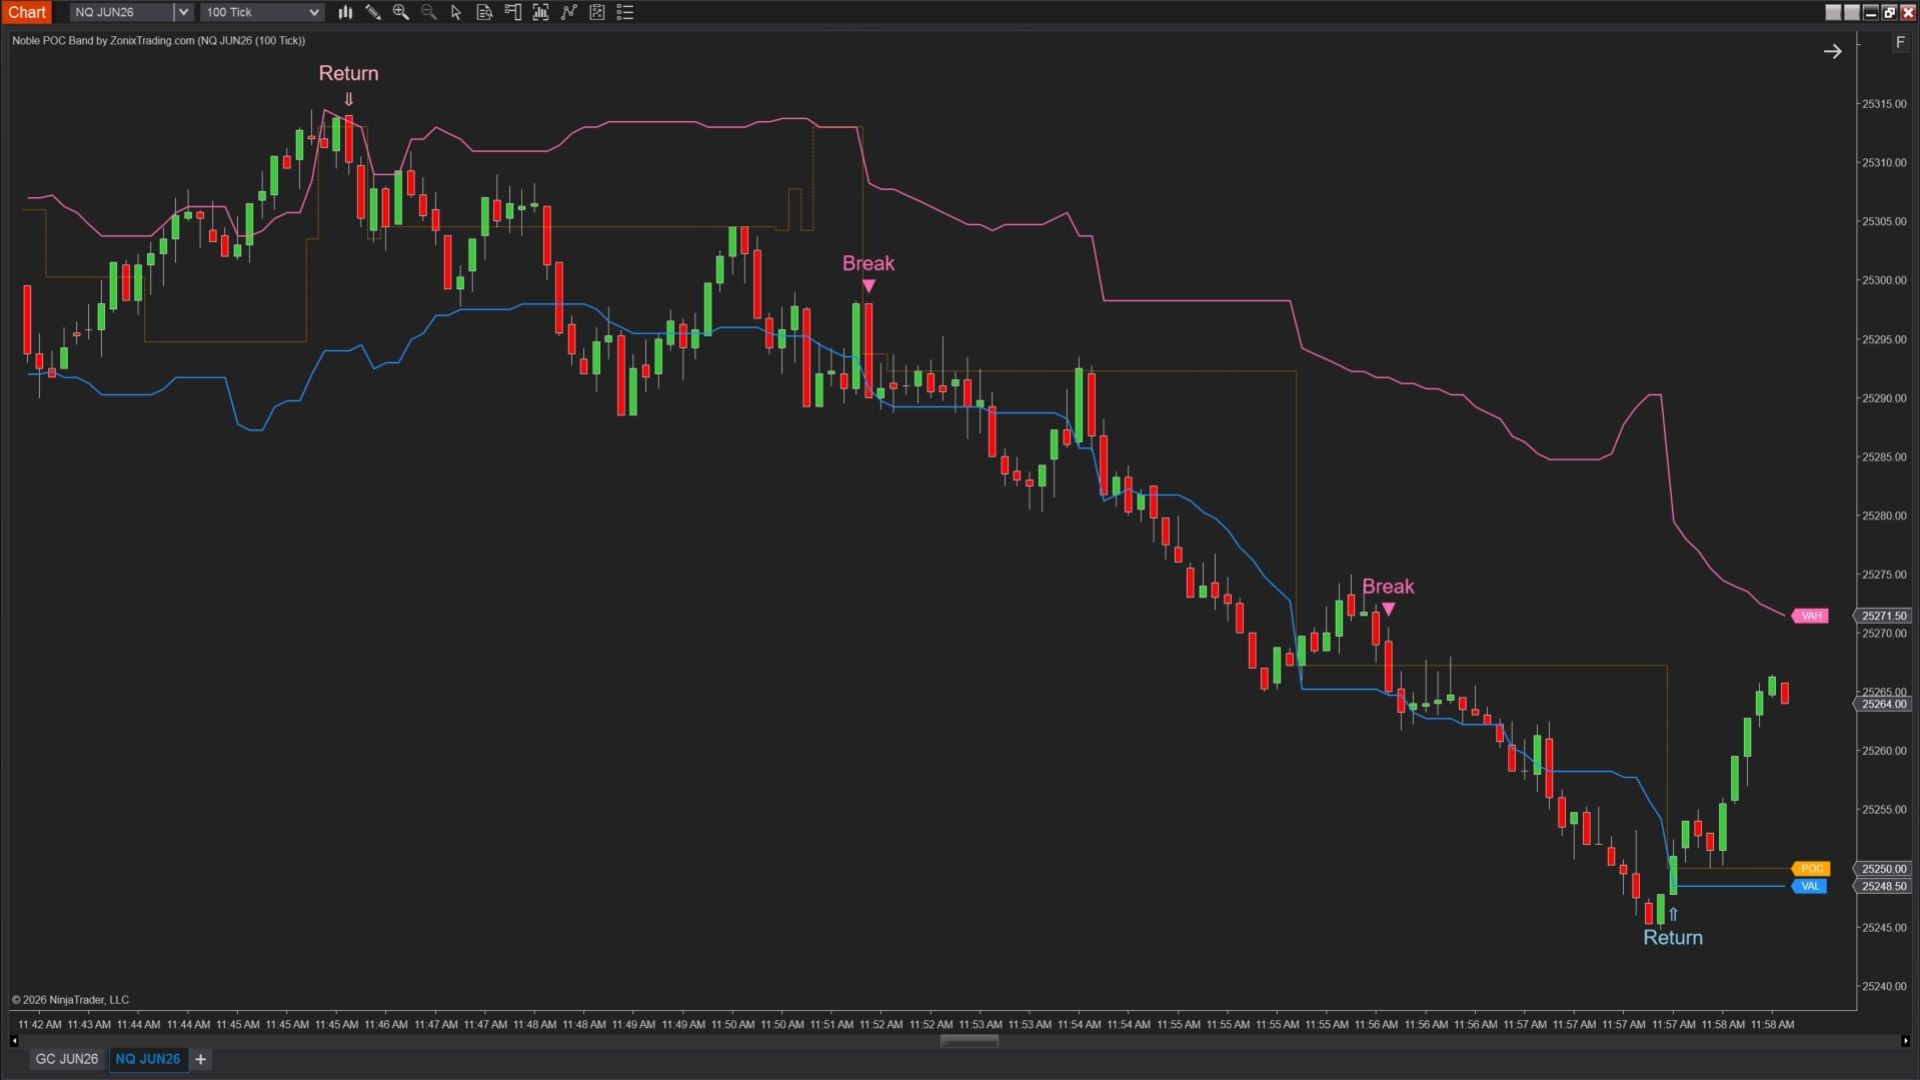
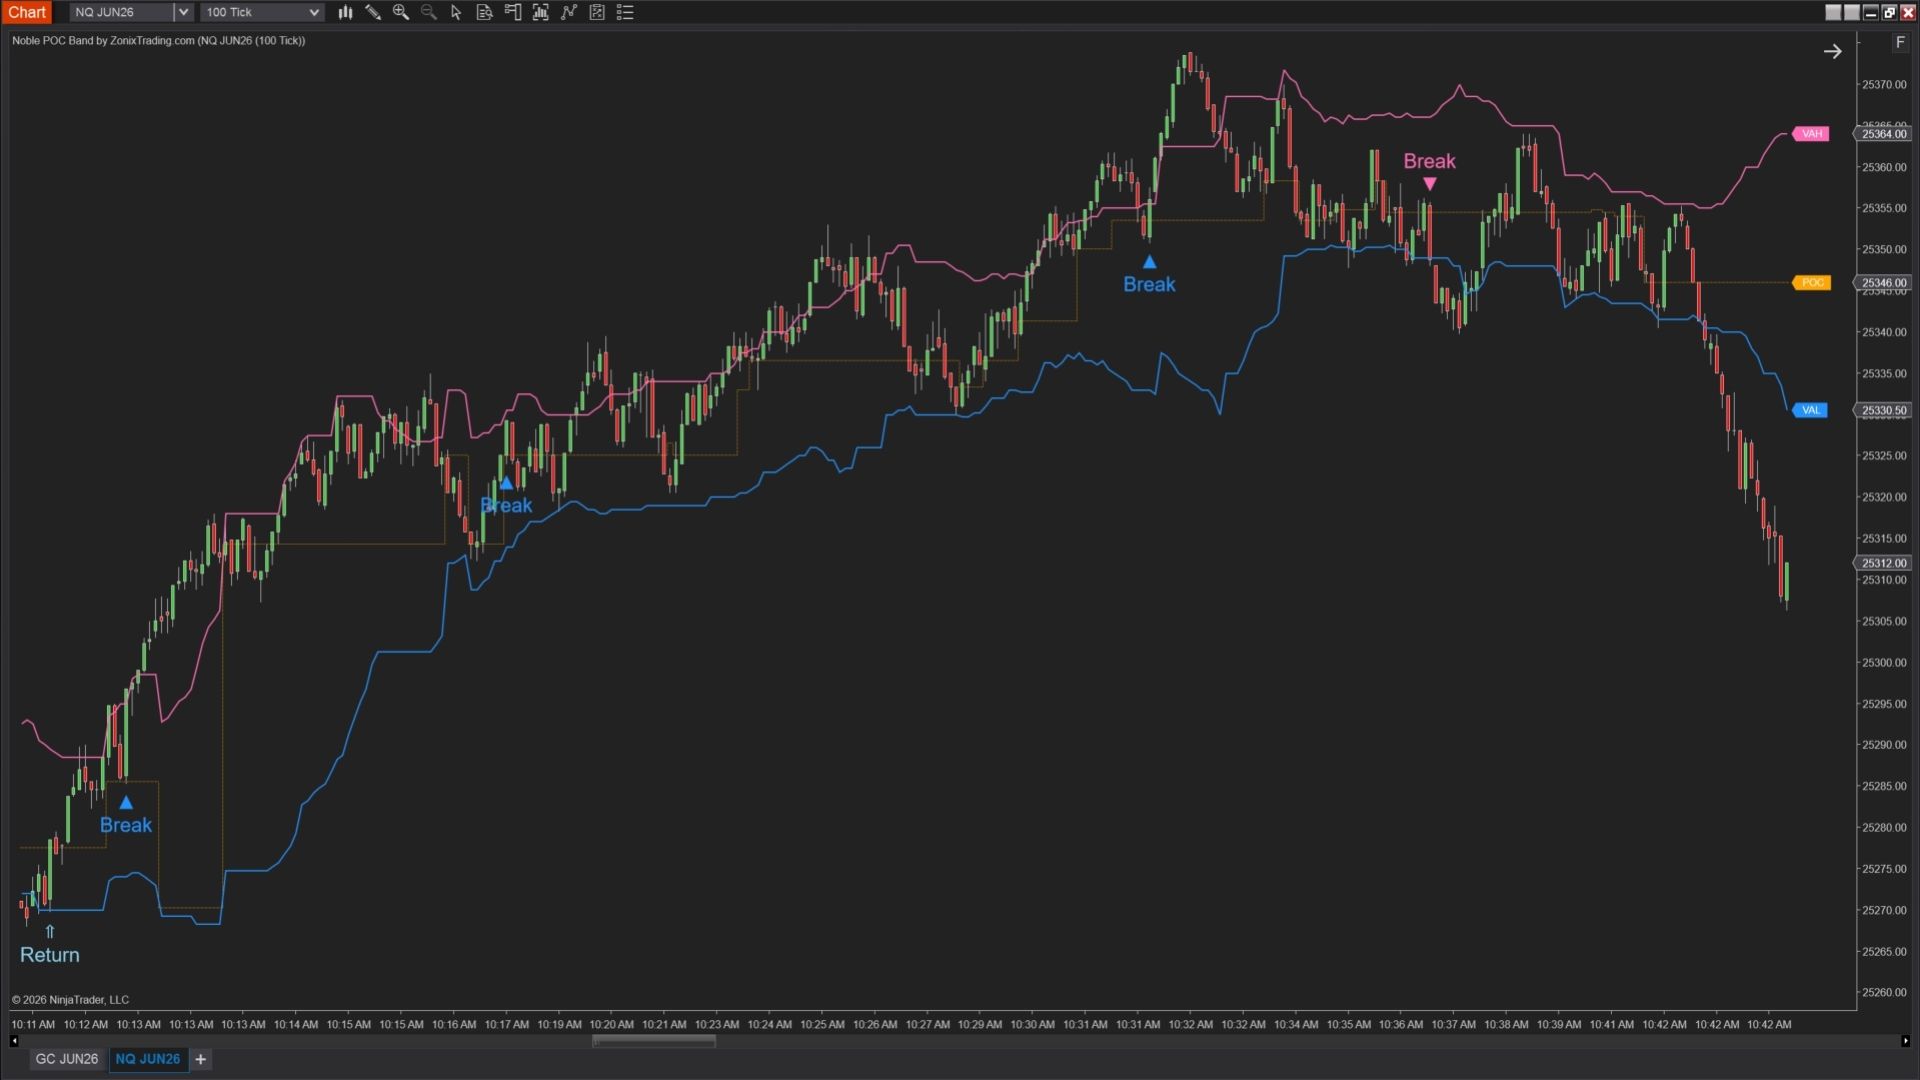
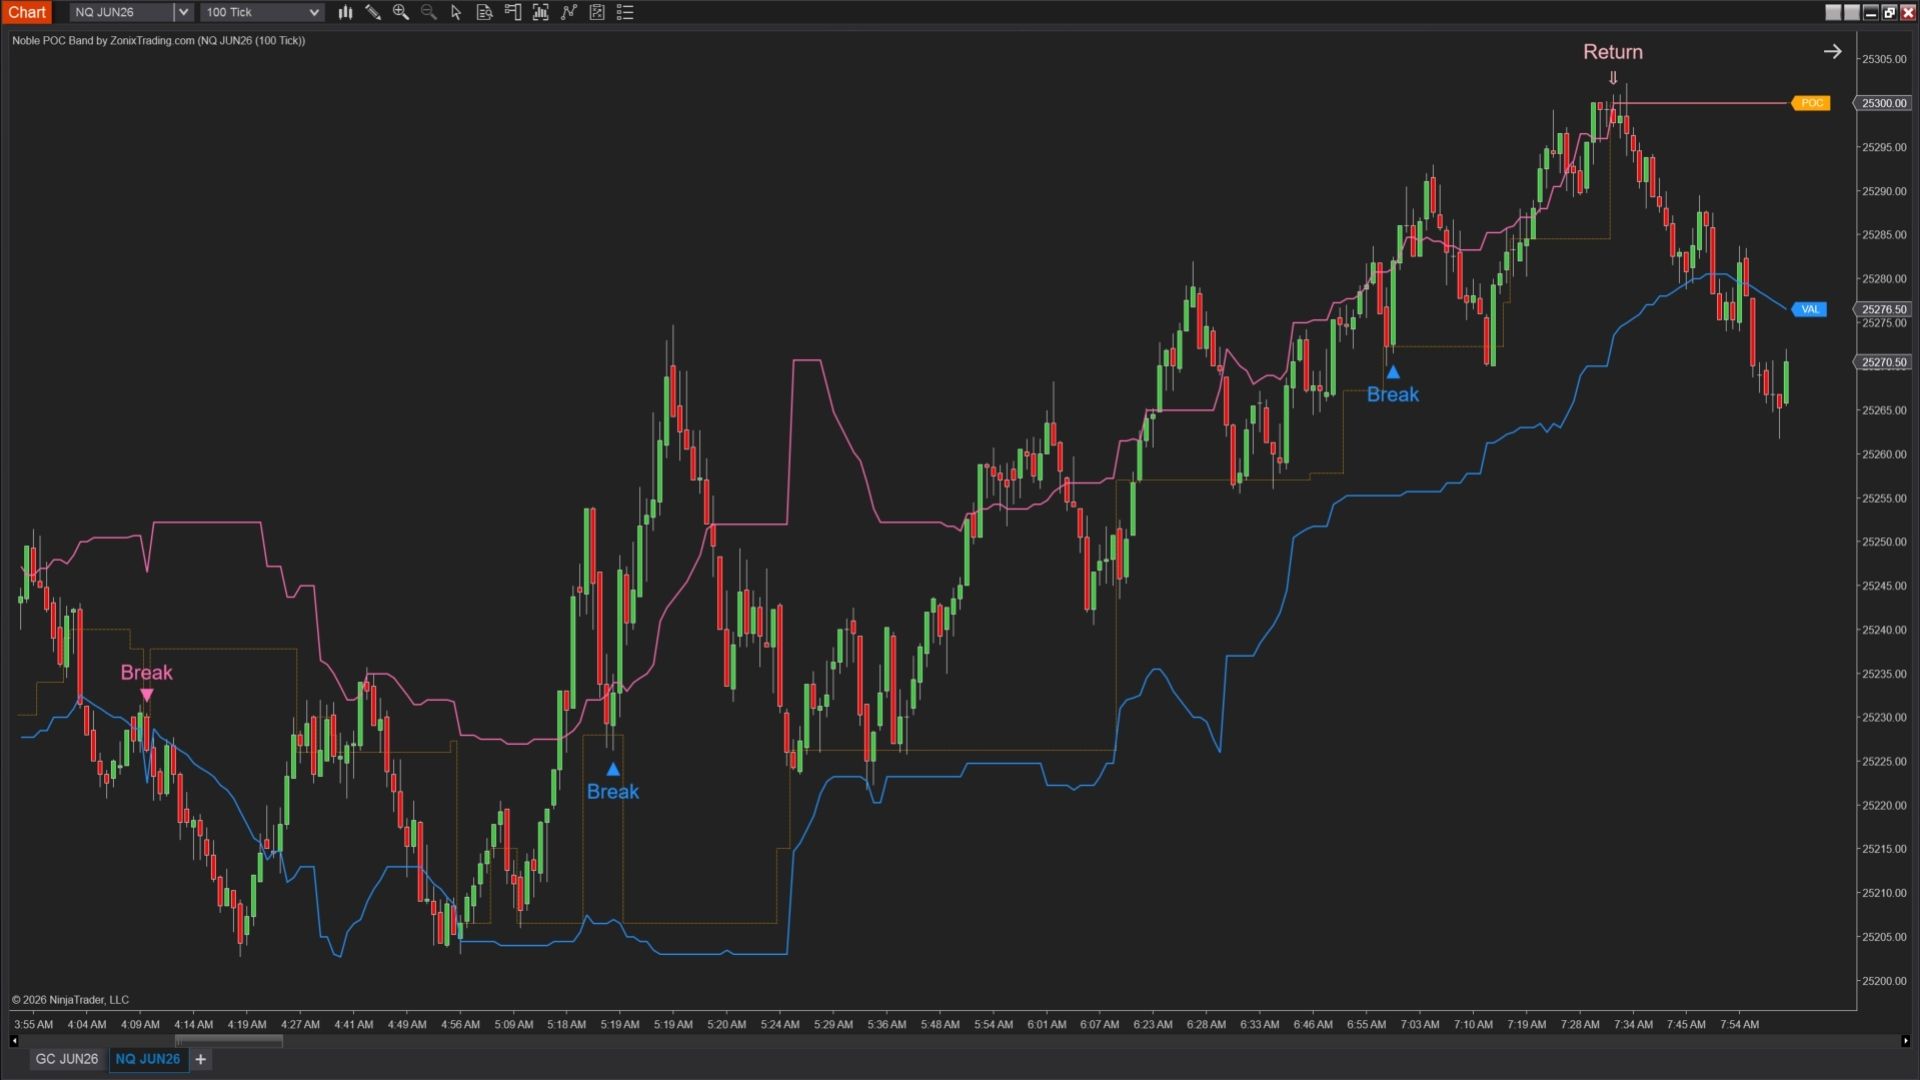
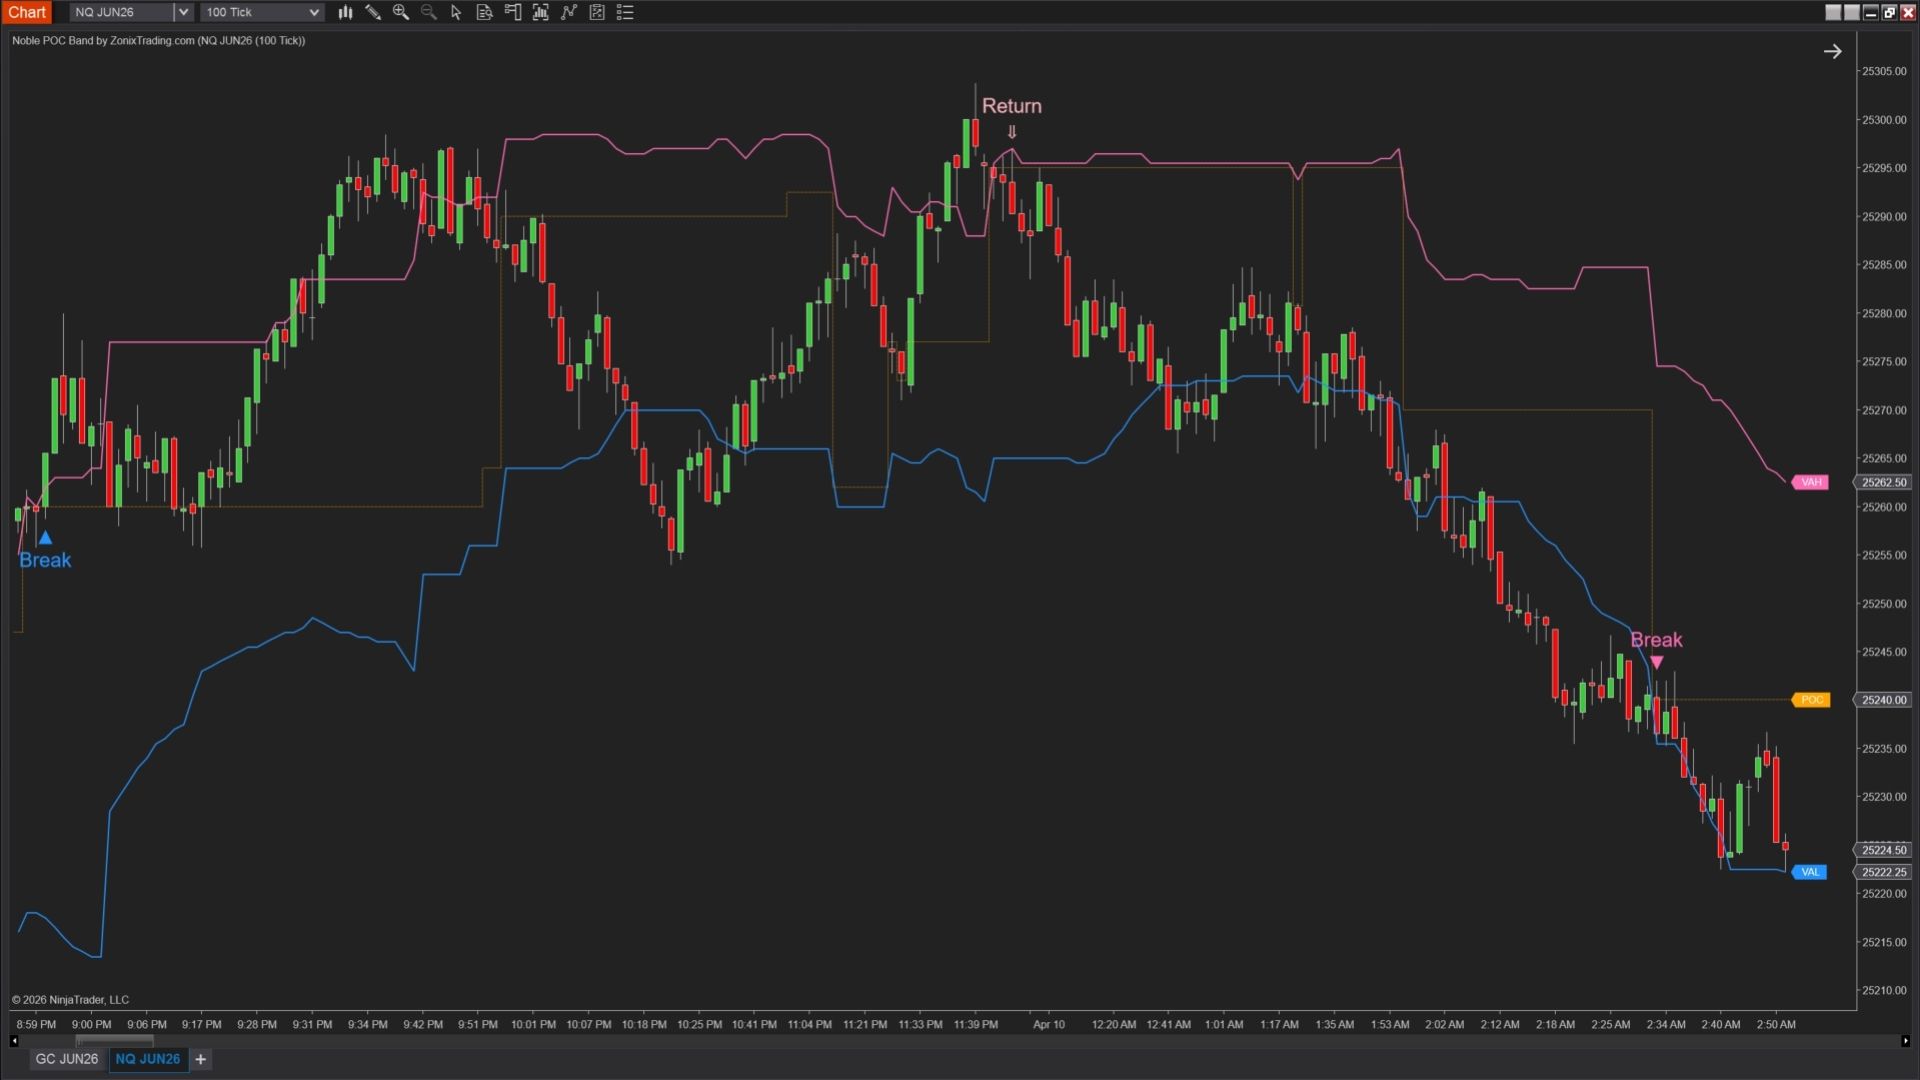
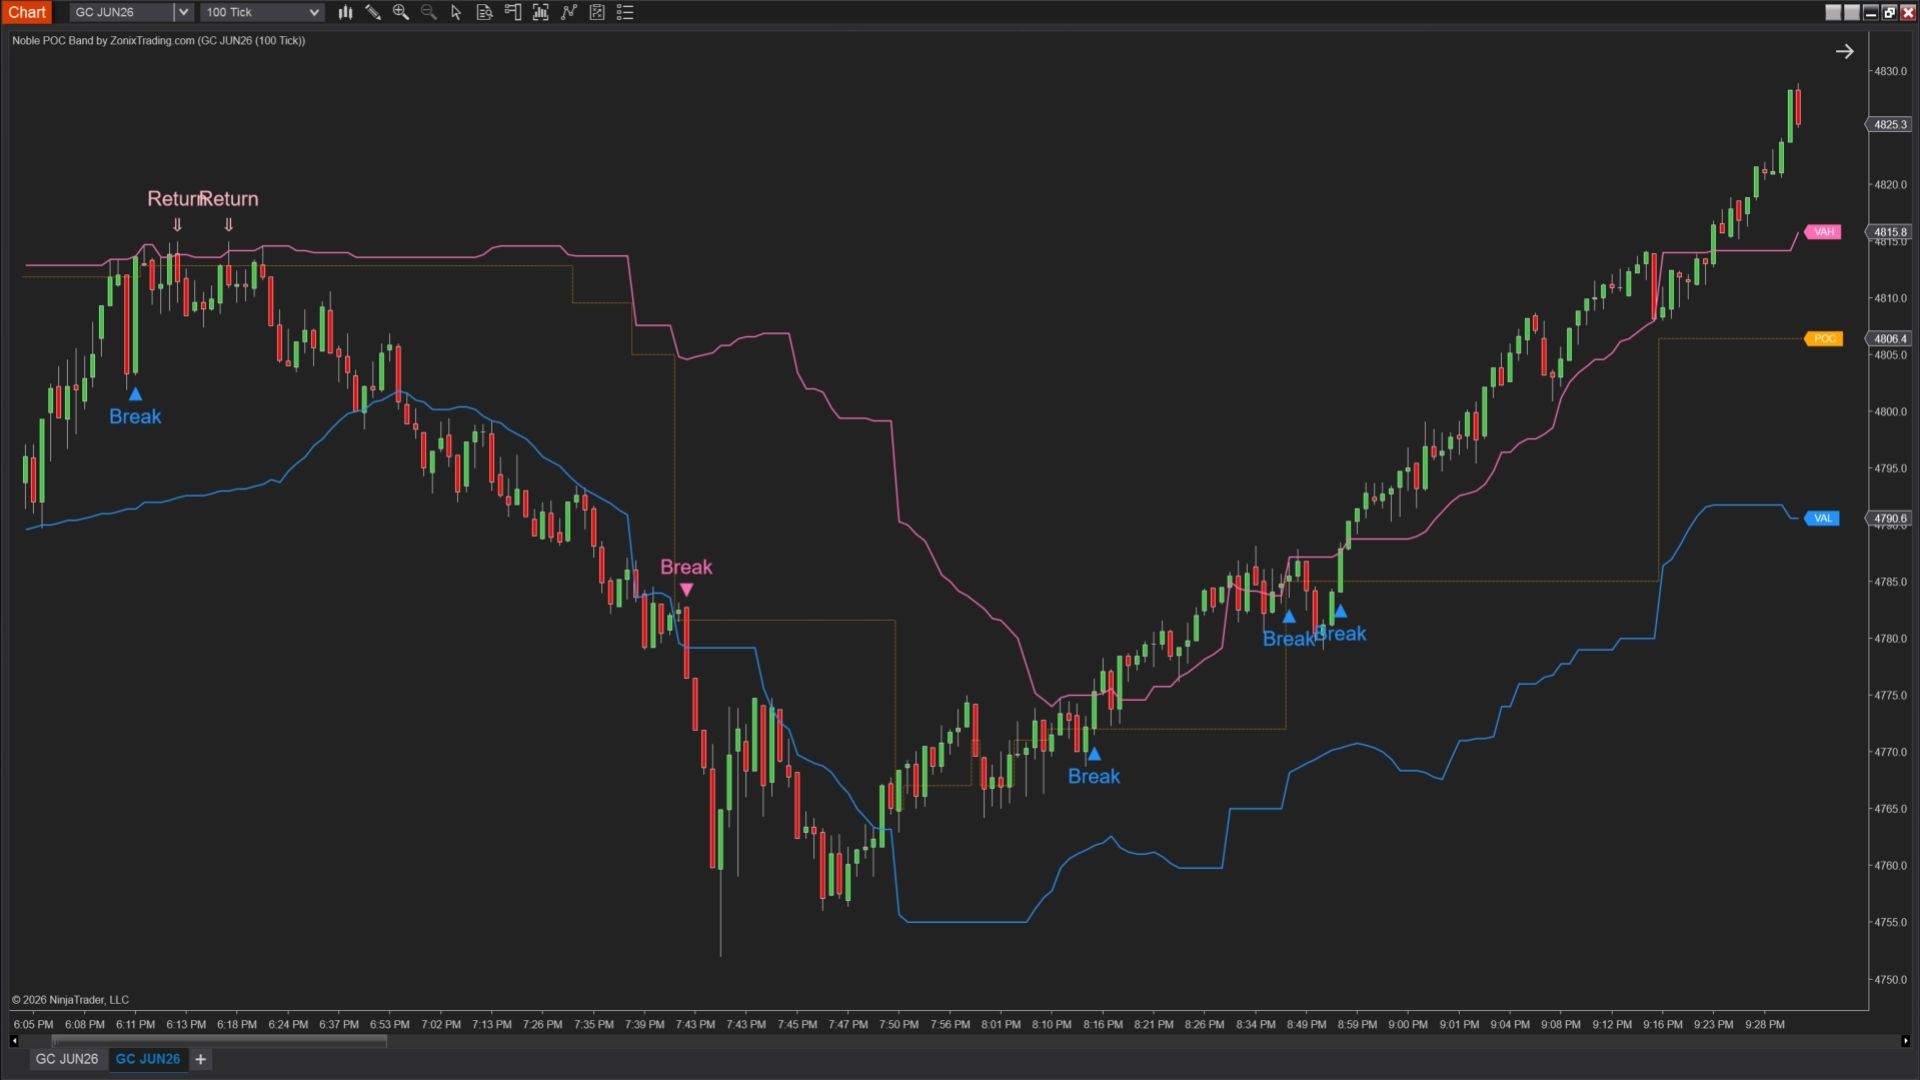
2 simple ways to use it
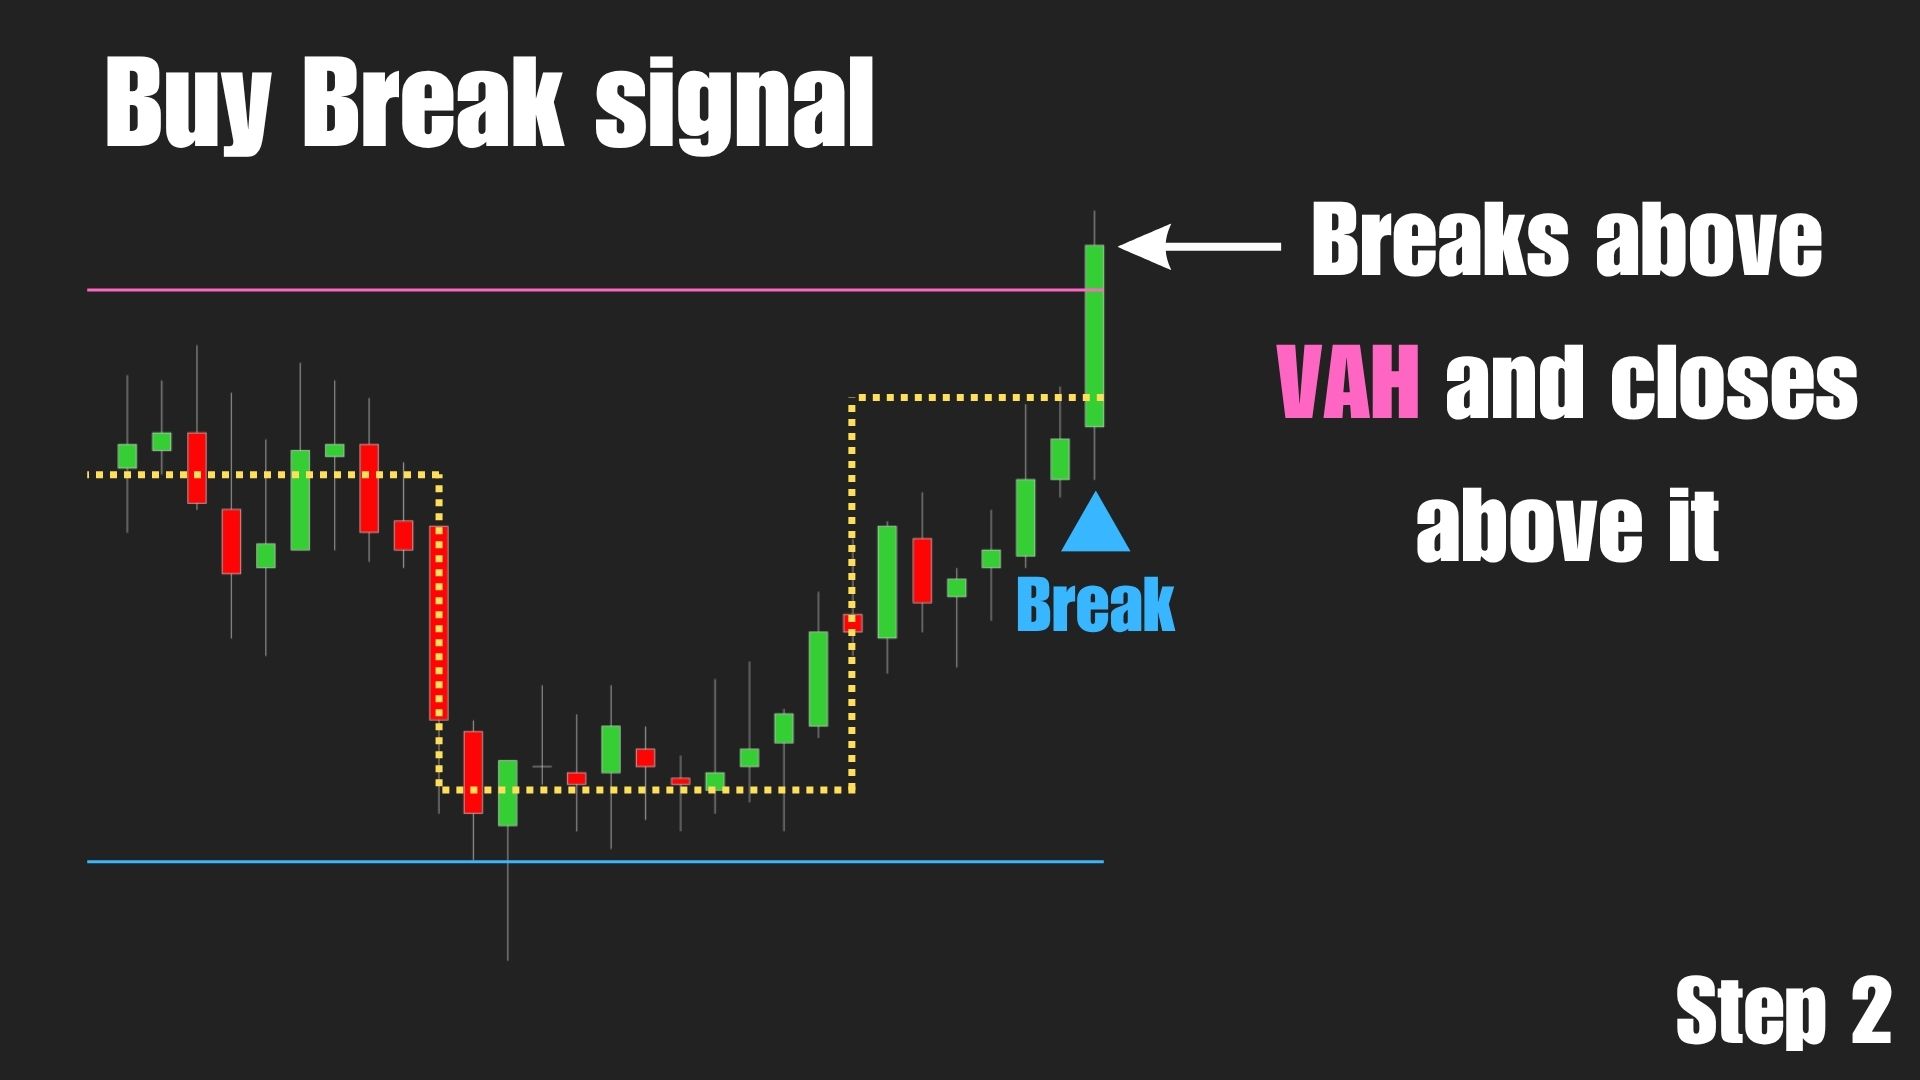
Break Setup (Continuation)
- Price moves through POC
- Breaks beyond VAH (long) or VAL (short)
- Holds outside the value area
→ Market is accepting a new price range
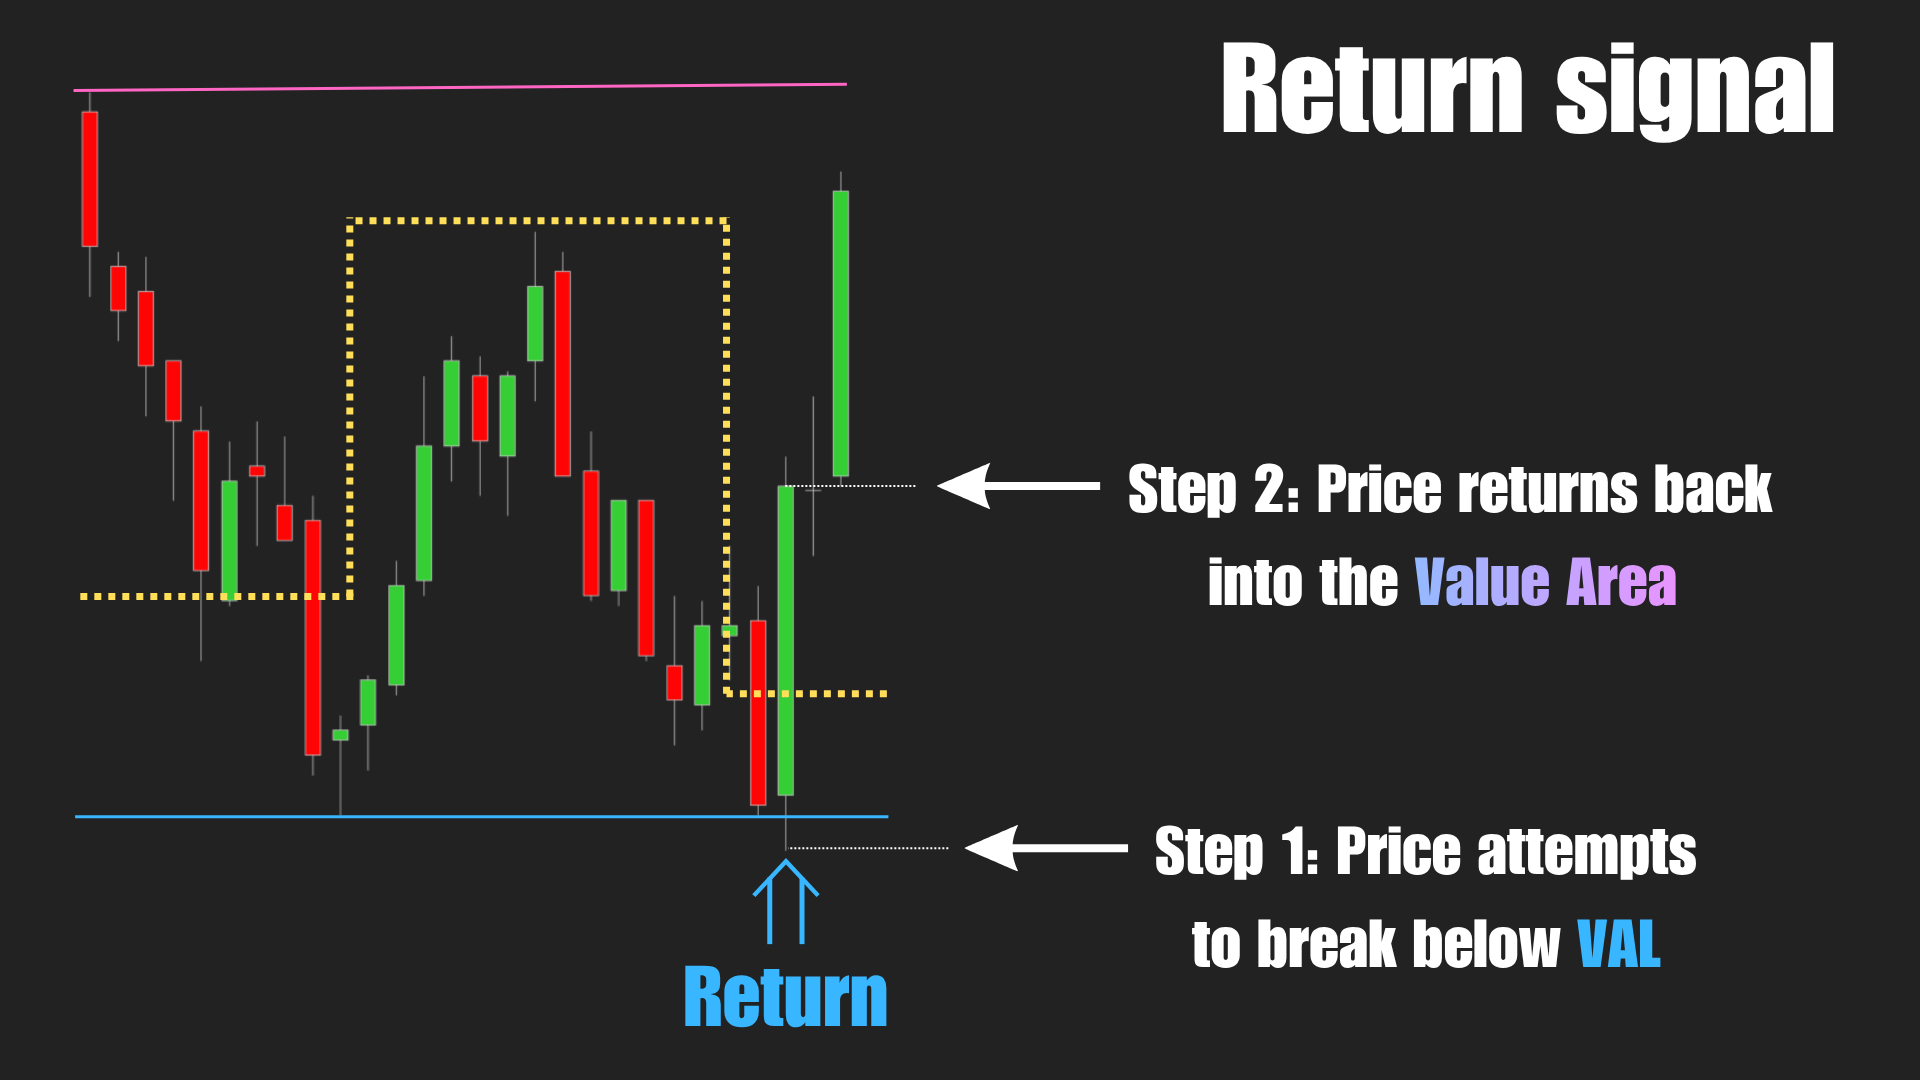
Return Setup (Reversal)
- Price breaks out
- Fails to hold
- Returns back into the value area
→ Market rejects the move
→ Often creates a cleaner opportunity in the opposite direction

With Noble POC Band, you stop chasing breakouts and entering at random levels. You start waiting for one thing: Acceptance.
Quick comparison
| Traditional Bands | Noble POC Band | |
| Built on | Price | Volume + Value |
| Shows | Volatility | Market acceptance |
| Breakouts | Often noisy | Filtered |
| Core question | Is price moving? | Is price accepted? |
Instead of asking: “Is price breaking out?”
You start asking: “Is the market accepting this price?”
Price can go anywhere. It only stays where the market agrees to trade.
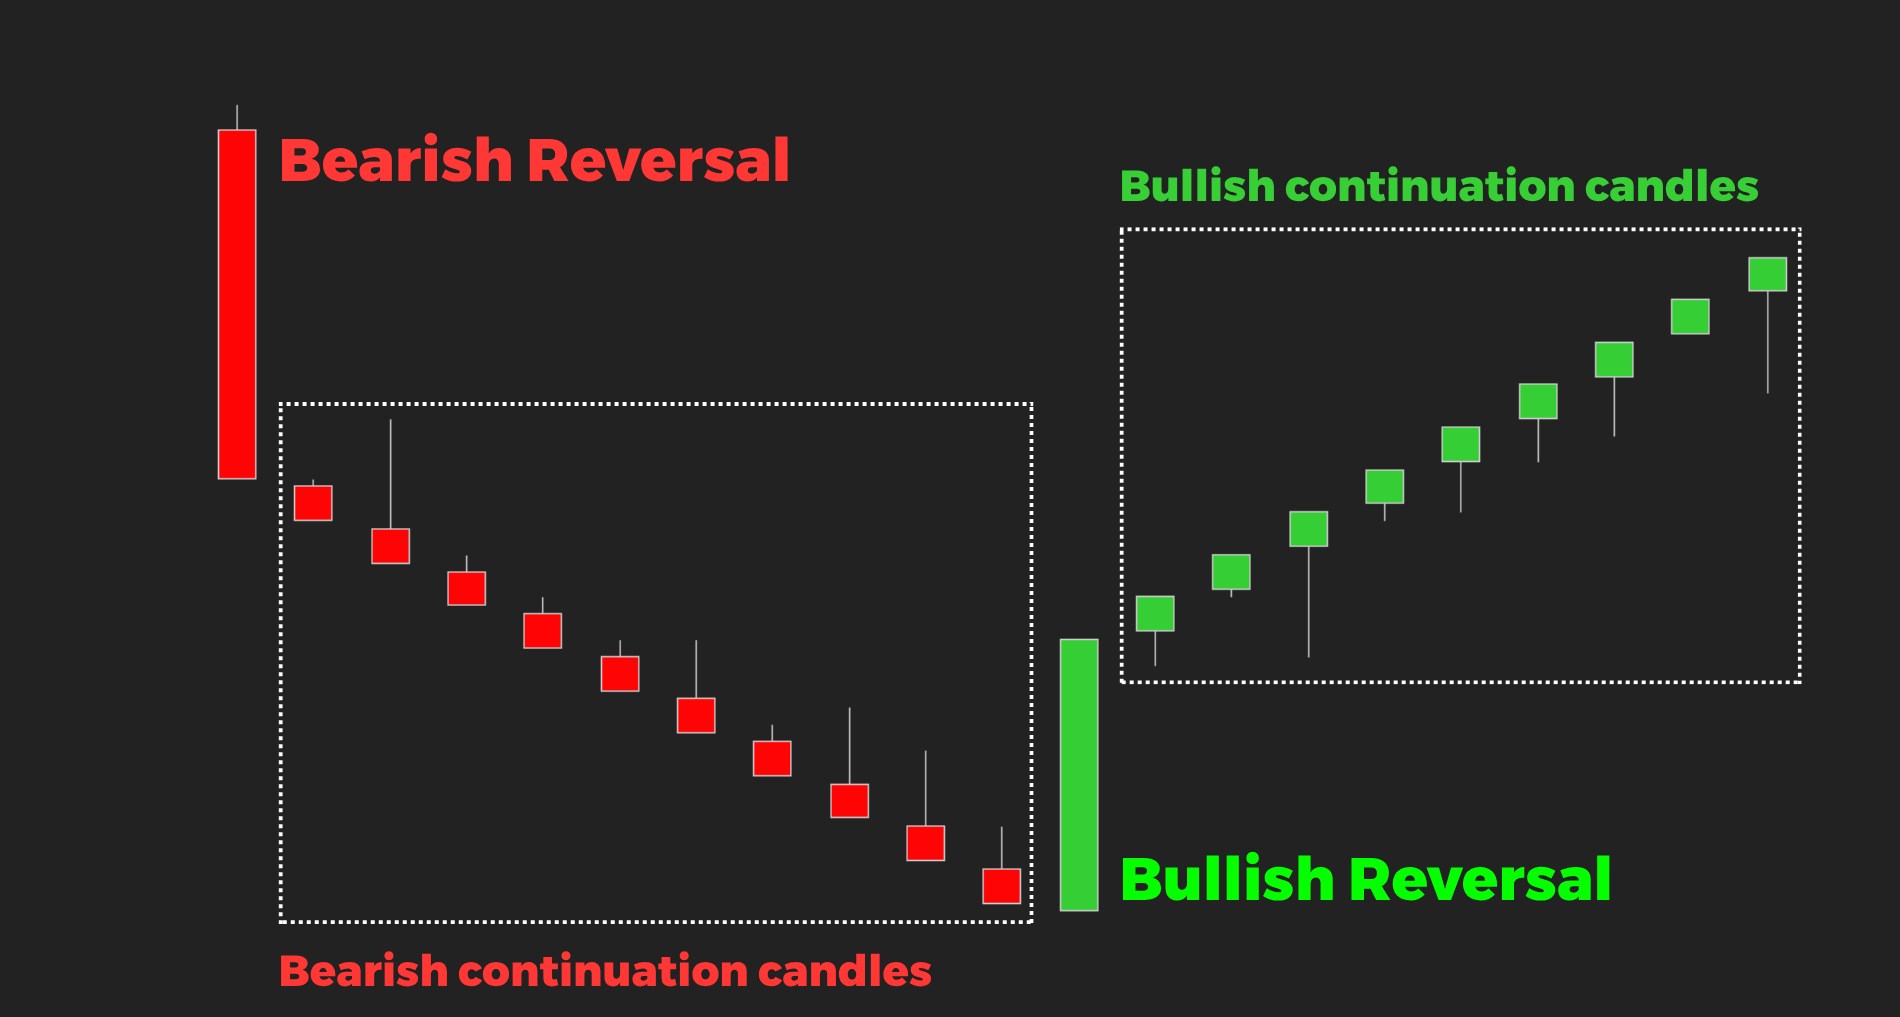
2. ZonixRenko
Do you ever feel like the chart is just… too noisy?
Price moves up, pulls back, moves again. Candles overlap, signals conflict.
What looks like a reversal… turns out to be just a pause.
So you hesitate. Or you enter too early.
Then the real move starts – and you’re late.
This isn’t about reading price wrong. It’s about how price is presented to you.
Most charts show every move – but not every move matters
Time-based charts print everything:
- small pullbacks
- random fluctuations
- short-term reactions
The result is simple:
Too much information, not enough clarity.
The problem with false reversals
Most systems flip direction too easily.
A small move in the opposite direction – and suddenly you get a “reversal”.
ZonixRenko removes those problems at the source
ZonixRenko-chart-sdojnjf49
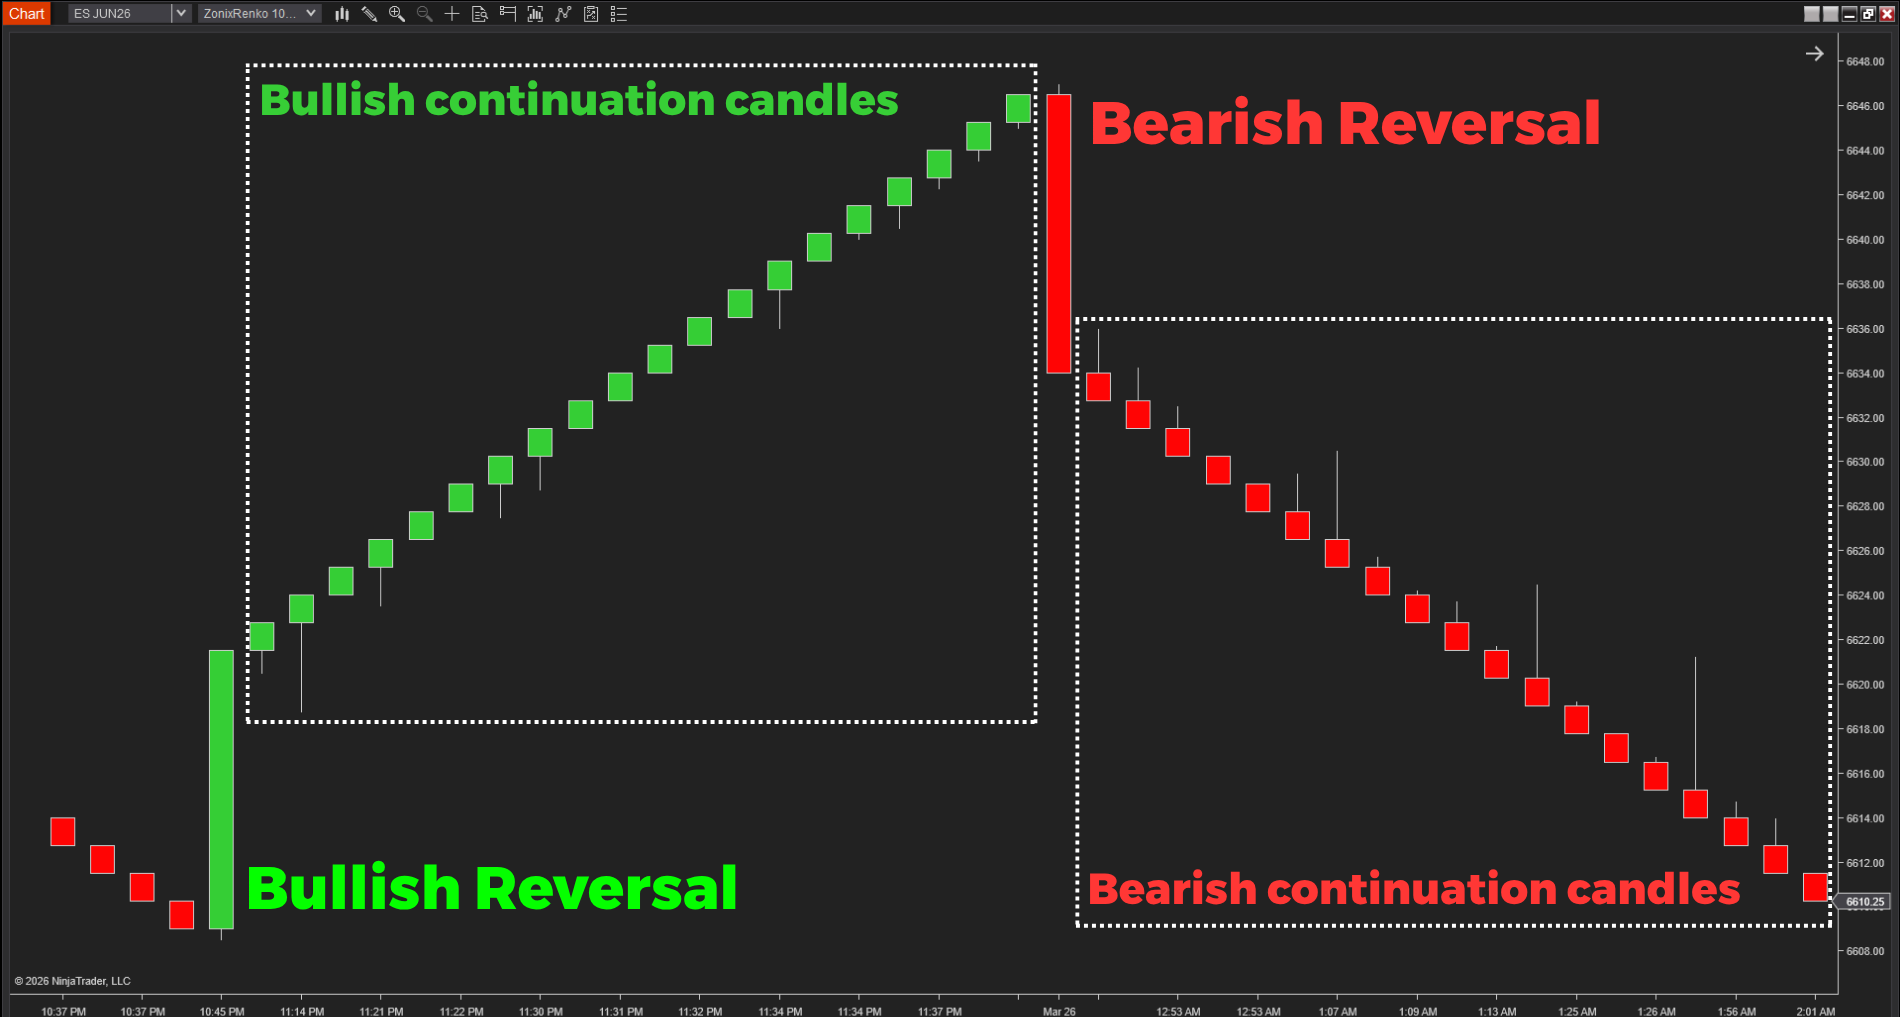
Noise disappears and structure stands out
It doesn’t use time. It only prints price when the move is large enough to matter.
That alone already changes how you see the chart:
✓ trends become cleaner
✓ noise disappears
✓ structure stands out
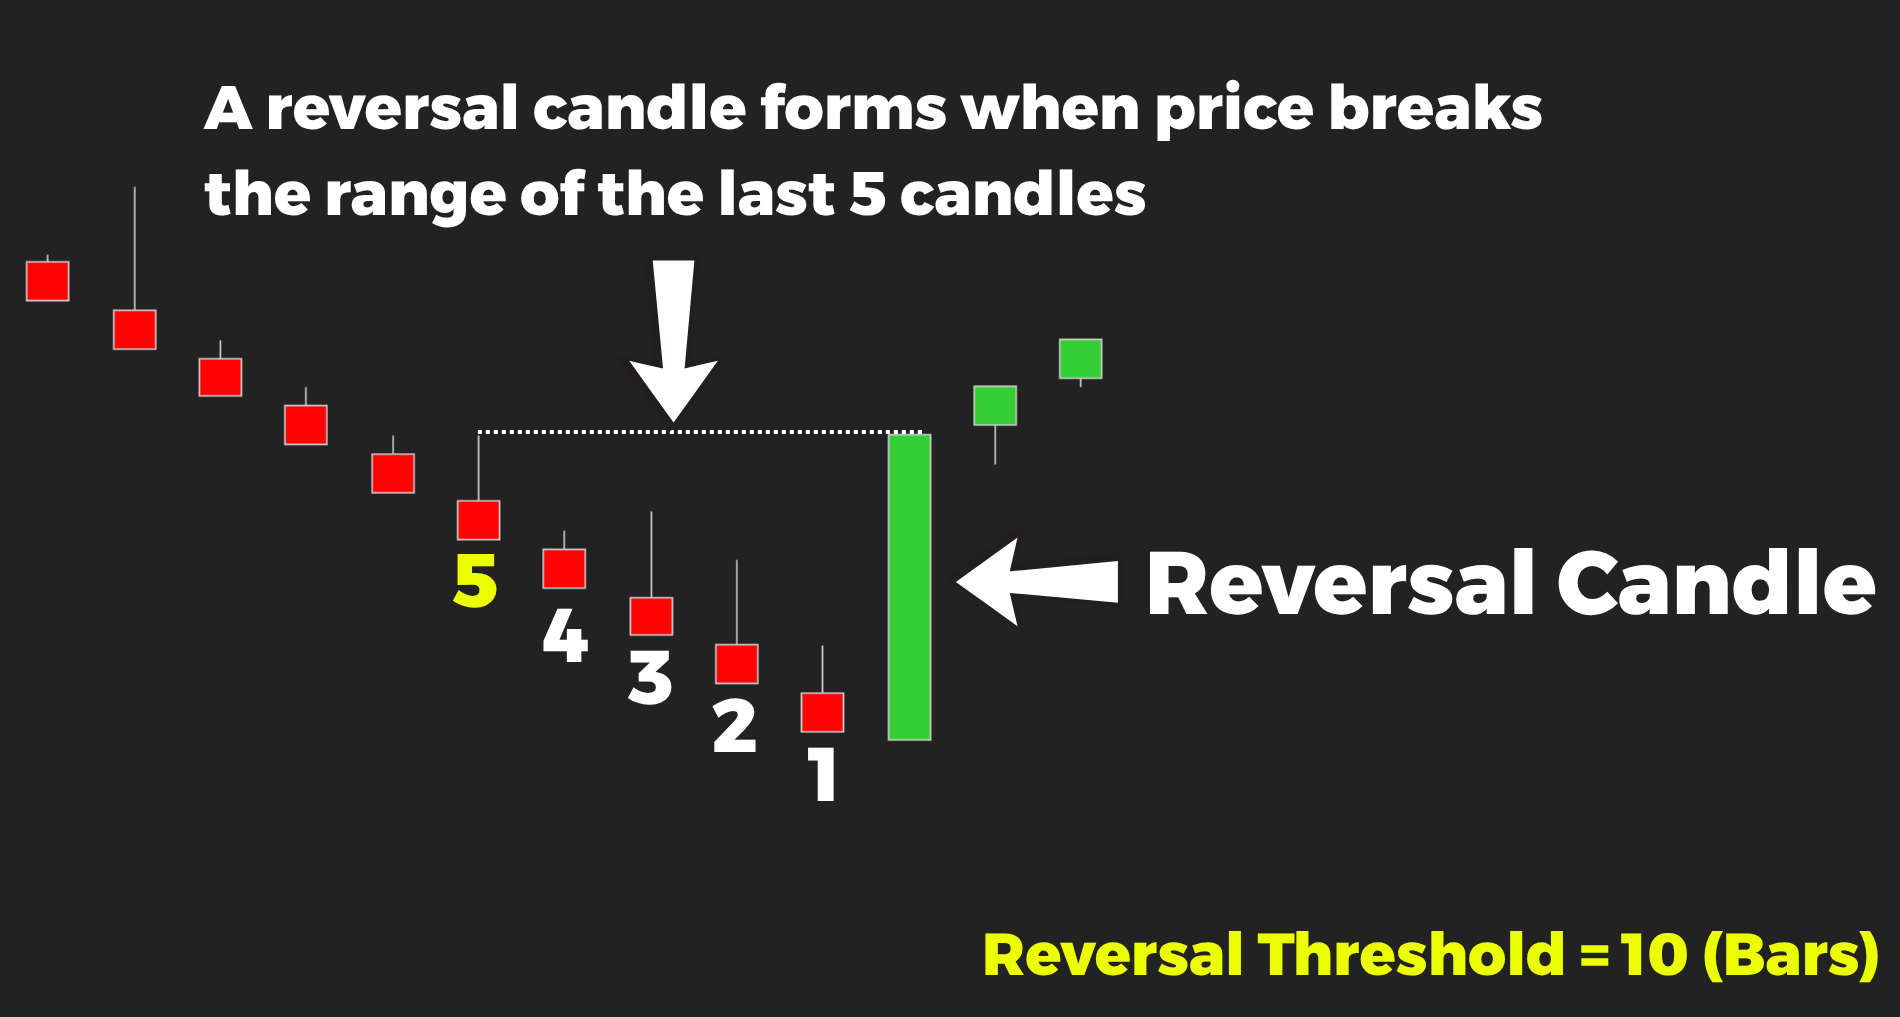
Reversal requires a full structural break
A reversal bar only appears when price breaks the entire body range of the last N bars.
Not just touching a level, a wick or a pullback. It has to fully invalidate the recent move.
Because most false signals come from weak reversals. Small counter-moves that don’t actually change control.
ZonixRenko filters those out. So when a reversal appears:
→ it already carries structural meaning
Continuation is just as strict
New bars don’t form unless price moves a fixed distance.
That means:
✓ no small candles
✓ no hesitation bars
✓ no “fake continuation”
If the trend is printing – it’s because price is actually moving.


How to read it in practice
Trend
As long as bars keep printing in one direction:
→ momentum is real
→ structure is intact
You don’t need to react to every minor pause.
Reversal
When a reversal bar appears:
→ the previous structure has been broken
→ the move is no longer just a pullback
This is where trend transitions begin and early entries become possible!


With ZonixRenko, you stop reacting to noise and getting pulled into every small move.
You start seeing:
- when a trend is actually building
- when a move is actually breaking
Quick comparison
| Standard charts | ZonixRenko | |
| Based on | Time + Price | Price only |
| Shows | All movement | Filtered movement |
| Reversal logic | Reactive | Structural |
| Trend clarity | Mixed | Clean |
| Core question | What is happening now? | Has anything actually changed? |
So, instead of asking: “Is price moving?”
You start asking: “Has the structure actually changed?”
Price will always move. But only some moves deserve your attention.
3. ZonixVector
Built on the same core idea as ZonixRenko – but with stricter confirmation
ZonixVector follows the same core principle as ZonixRenko: removing noise and focusing only on meaningful price movement.
The difference is in how reversals are defined.
- ZonixRenko → reversal when price breaks the body range
- ZonixVector → reversal only when price breaks the full range (including wicks)

Why this matters
Wicks often represent areas of strong conflict between buyers and sellers.
When price only breaks the body, the move may still be uncertain.
But when it breaks through the entire range – including wick extremes dg
it’s no longer just a reaction.
It’s a clear rejection of the previous move.
→ The market is not just testing – it’s taking control.
What you get
✓ Fewer signals
✓ Larger reversal candles
✓ Stronger structural meaning
✓ Higher confirmation quality


ZonixRenko vs ZonixVector
| ZonixRenko | ZonixVector | |
| Reversal rule | Body break | Full range break |
| Signal timing | Earlier | Fewer |
| Signal count | More | Low |
| Confirmation | Moderate | Stronger |
When should you use each?
ZonixRenko acts earlier – ZonixVector confirms deeper.
Use ZonixRenko when:
✓ You want earlier entries
✓ You’re looking for more trading opportunities
✓ You’re comfortable acting with less confirmation
Use ZonixVector when:
✓ You want stronger confirmation before entering
✓ You want to filter out weak reversals
✓ You prefer waiting for structure to be clearly broken
A more efficient way to access the full suite
Typically…
✓ Noble POC Band is valued at $400
✓ ZonixRenko is valued at $500
✓ ZonixVector is valued at $500
Today, you can access all 3 for just $326. Less than the cost of one – for the complete suite.
Please note, this exclusive offer is only available until May 12th. Be sure to take advantage before it ends!

Test the indicators in real market conditions for 30 days…
If it’s not working for you, simply switch to another indicator via our Zuture Exchange policy, with little to no extra cost.
Quick-start guide: How to install ZonixTrading indicators
Explore our Bestsellers & New releases
If you’re looking to enhance your setup, check out our bestsellers and new releases, available at accessible prices. These could be great additions to complement Noble POC Band, ZonixRenko, or ZonixVector.
Browse through and see what fits your strategy.
Products by Category
-
Noble POC Band
Original price was: $396.$150Current price is: $150. -
ZonixRenko
Original price was: $496.$298Current price is: $298. -
Multi-Osc OB/OS Overlap
Original price was: $596.$298Current price is: $298. -
EOB Ordering
Original price was: $596.$298Current price is: $298. -
ATR-TradeShield
Original price was: $596.$298Current price is: $298. -
ZonixVector
Original price was: $496.$298Current price is: $298. -
EOB Exit
Original price was: $496.$347Current price is: $347. -
QuantZone
Original price was: $696.$348Current price is: $348. -
Multi-Instrument Synergy
Original price was: $696.$348Current price is: $348. -
[AbsP] MEO #8: Imbalance Insight Matrix + Romantick Pulse
Buy MashupOriginal price was: $1,192.$350Current price is: $350. -
Imbalance Insight Matrix
Original price was: $596.$358Current price is: $358. -
Multi-Timeframe Fu$ion
Original price was: $796.$398Current price is: $398. -
[AbsP] MEO #10 QuantZone + MagnetOsc Turbo
Buy MashupOriginal price was: $1,292.$400Current price is: $400. -
[AbsP] MEO #12: QuantZone + Sonarlike Iceberg Finder
Buy MashupOriginal price was: $1,392.$450Current price is: $450. -
[AbsP] MEO #13: QuantZone + BigTrade Sweep
Original price was: $1,392.$450Current price is: $450. -
[AbsP] MEO #9: MA Crossover + Superior Donchian + Momentum Pro + QuantZone
Buy MashupOriginal price was: $1,984.$600Current price is: $600. -
[AbsP] MEO #7: Captain Optimus Strong + QuantZone + Superior Donchian
Buy MashupOriginal price was: $3,188.$950Current price is: $950. -
Captain Optimus Strong
Original price was: $2,196.$1,098Current price is: $1,098. -
Infinity Algo Engine$
Original price was: $2,696.$1,348Current price is: $1,348.


![[AbsP] MEO #13: QuantZone + BigTrade Sweep](https://zonixtrading.com/wp-content/uploads/bigtrade-sweep-rhfbsdfvasdasd-300x300.png?crop=1)


