Description
Overview
Do you find yourself entering trades too early when overbought/oversold signals appear?
Is your chart cluttered with overlapping RSI, MFI, and Stochastic indicators?
Multi-Osc OB/OS Overlap was built to address exactly that.
It combines 3 of the most widely used oscillators into a single, structured framework designed to filter out weak signals and highlight only the areas where true consensus exists.
By aligning momentum, volume pressure, and price positioning, it helps you focus on higher-probability overbought and oversold conditions—without the usual chart clutter.
Key features
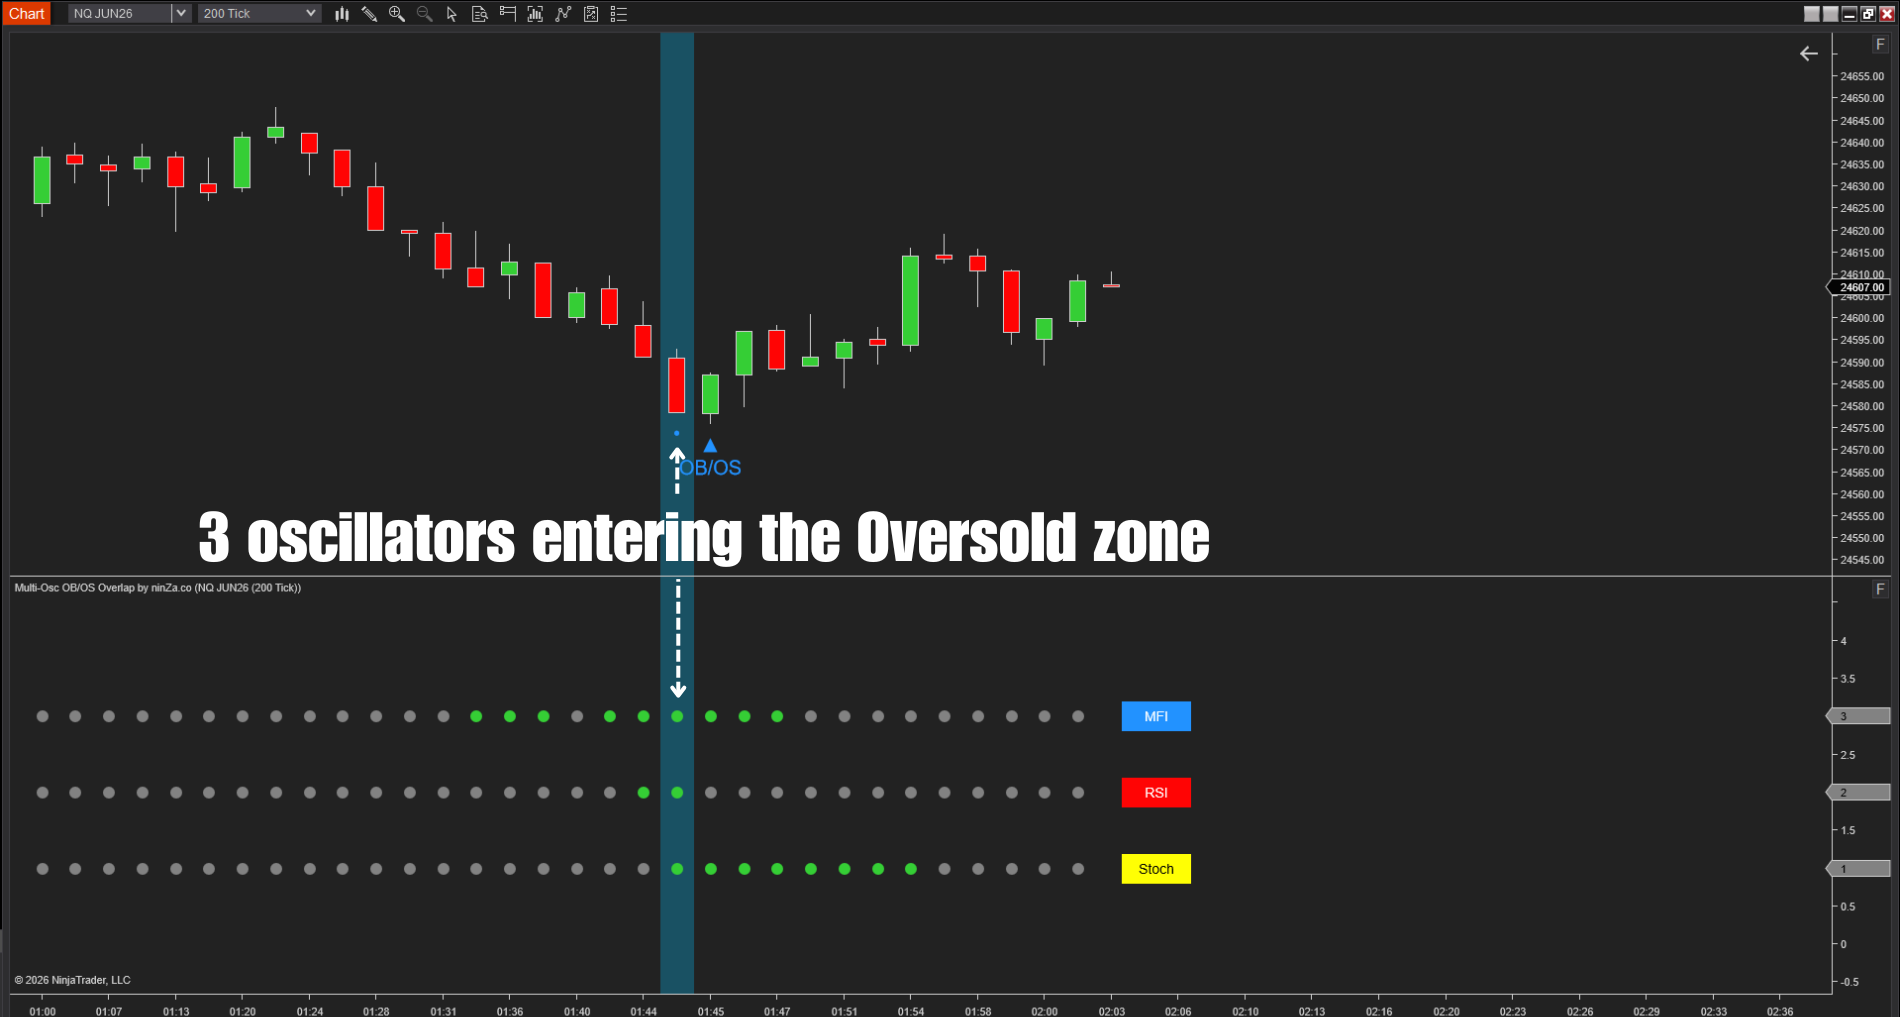
- Triple oscillator confluence: Monitors MFI, RSI, and Stochastic simultaneously to identify zones of extreme market exhaustion.

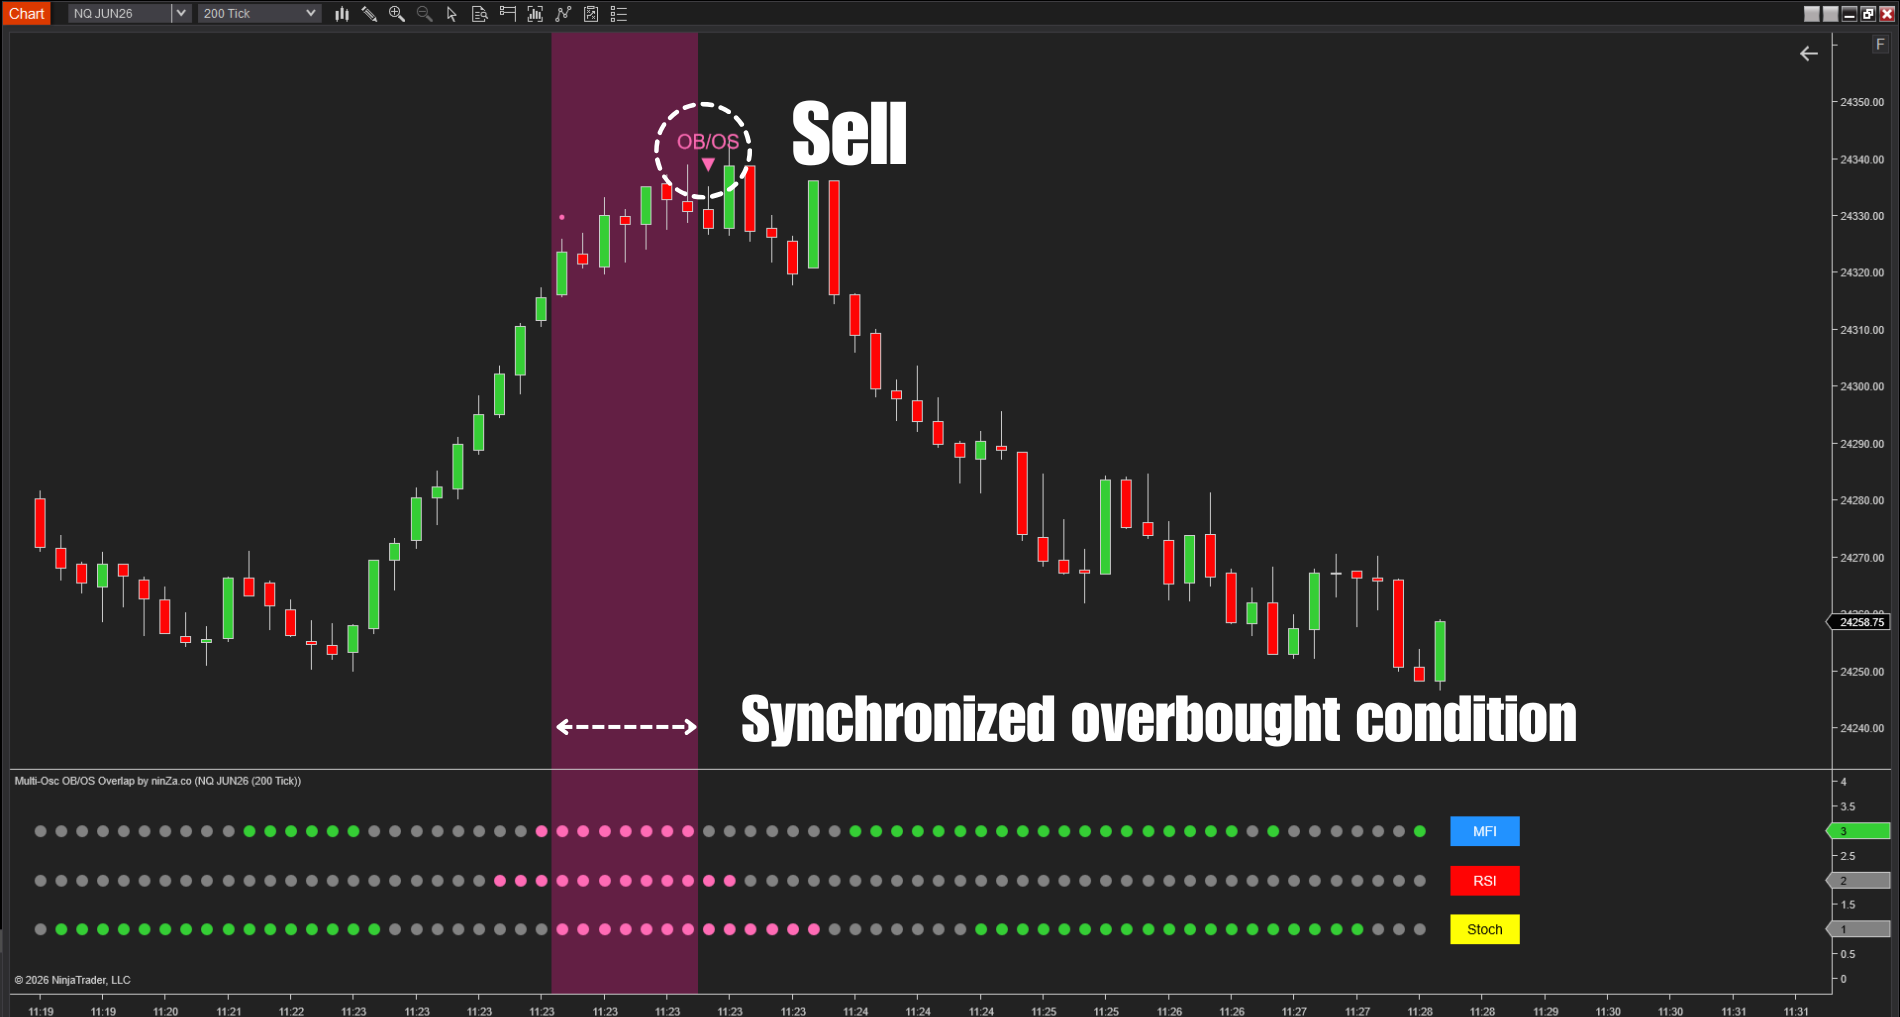
- Dynamic zone visualization: Automatically paints the chart background (Green for Oversold, Pink for Overbought) only when all three indicators overlap.
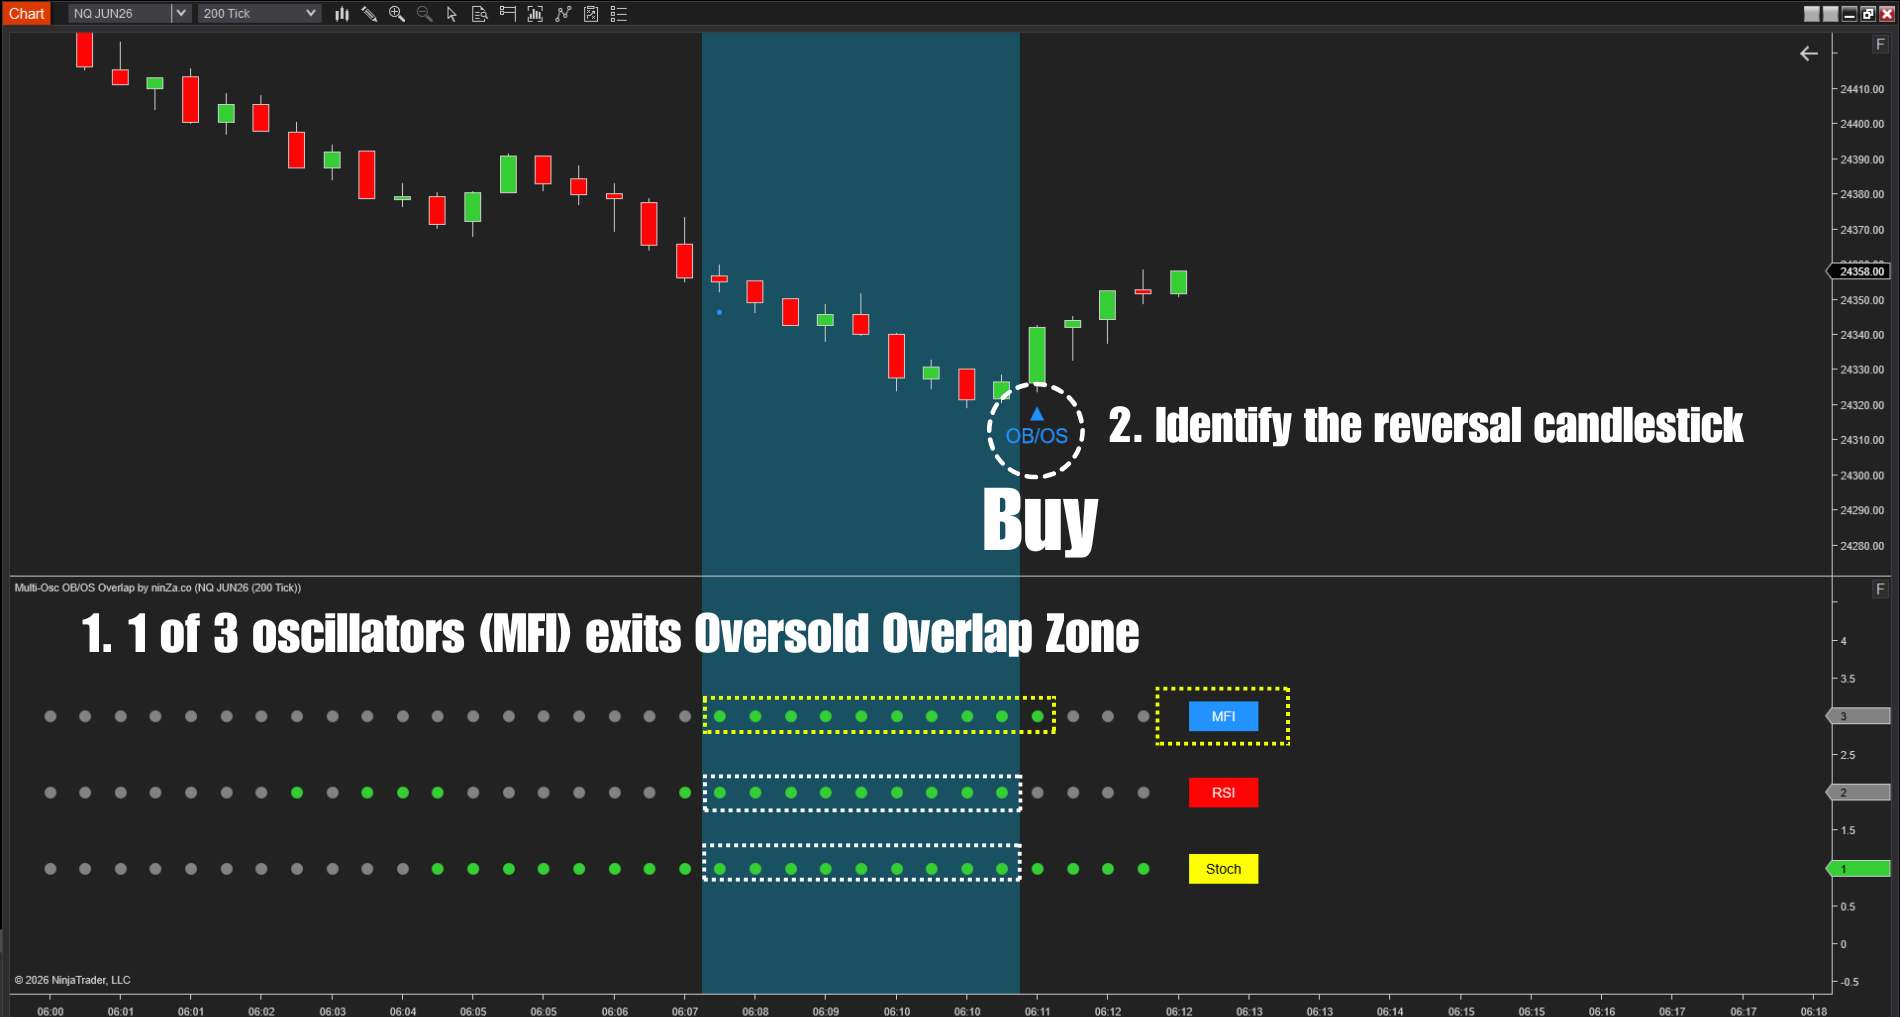
- Integrated price action filter: Goes beyond simple OB/OS readings by searching for a reversal candlestick confirmation immediately after a zone exit.
- Chart real estate efficiency: Consolidates 3 separate indicator windows into one clean, visual overlay, freeing up space for order flow or volume profile tools.
- Smart visual alerts: Features on-chart markers and color-coded lines for rapid signal recognition at a glance.
Signal mechanism
Multi-Osc OB/OS Overlap follows a structured 3-step workflow to identify trade setups:
1. Overlap detection: All 3 oscillators must enter the user-defined OB/OS thresholds simultaneously, creating an “Overlap Zone”.
2. Zone exit: The indicator monitors for the moment the overlap ends, signaling a potential shift in market momentum.
3. Reversal confirmation: After the exit, the indicator scans a user-defined Lookback Window (number of subsequent bars). If a reversal candlestick pattern appears within this window, a definitive entry signal is triggered.
Configurable parameters
- Individual thresholds: Set separate High (Overbought) and Low (Oversold) levels for MFI, RSI, and Stochastic to match your specific asset class (Futures, Forex, or Equities).
- Reversal search window: Define exactly how many bars the indicator should monitor for a reversal signal after the overlap ends.
- Customizable aesthetics: Fully adjustable colors for Overlap Zones, Neutral states, and Signal Markers to fit any dark or light chart template.


![[AbsP] MEO #4: Imbalance Insight Matrix + Gravity OrbitX](https://zonixtrading.com/wp-content/uploads/Gravity-OrbitX-Imbalance-Insight-Matrix-300x300.png?crop=1)
![[AbsP] MEO #3: Imbalance Insight Matrix + StepMA Crossover](https://zonixtrading.com/wp-content/uploads/Imbalance-Insight-Matrix-StepMA-Crossover-2-300x300.png?crop=1)
![[AbsP] MEO #2: Imbalance Insight Matrix + Imbalance Profile Lidar](https://zonixtrading.com/wp-content/uploads/ImbalanceInsightMatrix-_ImbalanceProfileLidar-300x300.png?crop=1)