Description
Most imbalance zones look the same – but not all of them matter
When trading imbalance, the issue isn’t finding zones – it’s knowing which ones are worth paying attention to.
If you mark everything, you usually end up with:
- Too many zones
- Conflicting signals
- No clear decision point
This is where clarity starts to disappear.
Imbalance Insight Matrix is built to filter that out – keeping only zones that show actual movement and follow-through, so you’re not reacting to every imbalance on the chart.
Why imbalance matters
Imbalance forms when price moves quickly in one direction, leaving behind unfilled orders that price often returns to.
But not every imbalance behaves the same.
For traders using tick charts and lower timeframes, imbalance becomes more useful – because price is broken down into smaller movements, allowing you to clearly see:
- Where one side takes control
- Where price pushes with intent
- Where imbalance forms in real time
On higher timeframes, everything is compressed into fewer candles, so buying and selling activity is blended together, making these details harder to read.
Lower timeframes also make it easier to spot how larger players move – they tend to enter quickly and push price in short bursts, which is where imbalance comes from.
That’s why imbalance on lower timeframes is not just more frequent, but more precise – you’re seeing how the move actually forms, not a simplified version of it.
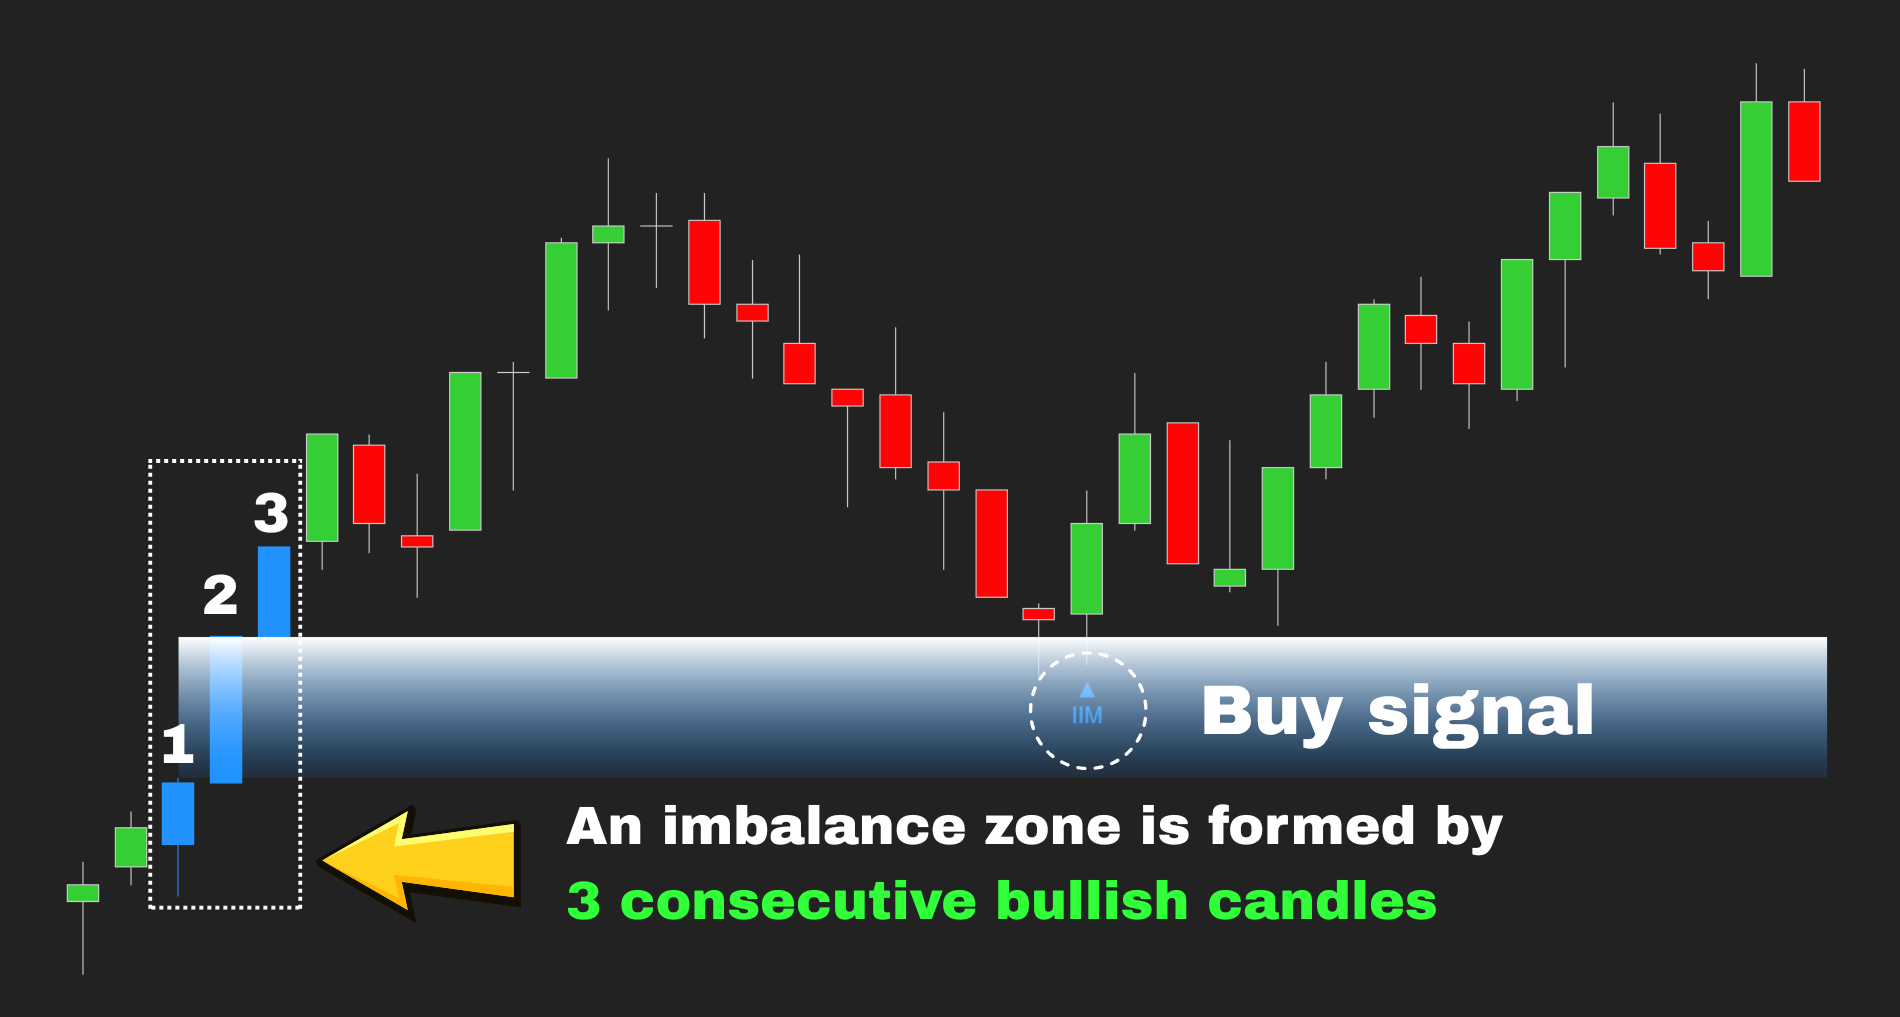


Imbalance Insight Matrix: Built on a 3-layer confirmation model
Instead of plotting every imbalance, the indicator filters them before showing anything.
Each zone must meet 3 conditions:
1. Structural strength (Candle validation)
The imbalance must come from a candle with the largest range among nearby candles.
If it doesn’t stand out, it’s likely just noise.
2. Real displacement (Continuation required)
After the imbalance forms, price needs to continue at least N ticks in the same direction.
If there’s no follow-through, the move doesn’t carry much significance.
3. No immediate return (Control must hold)
Price should not return to the imbalance within the next N candles.
If it does, it usually means the level wasn’t strong to begin with.
If a zone fails any of these, it is removed.

Why this matters
Instead of marking everything and second-guessing each zone, you’re left with imbalances that already demonstrate:
- Real movement
- Continuation
- Control from one side
So you spend less time filtering, and more time focusing on what’s actually tradable.
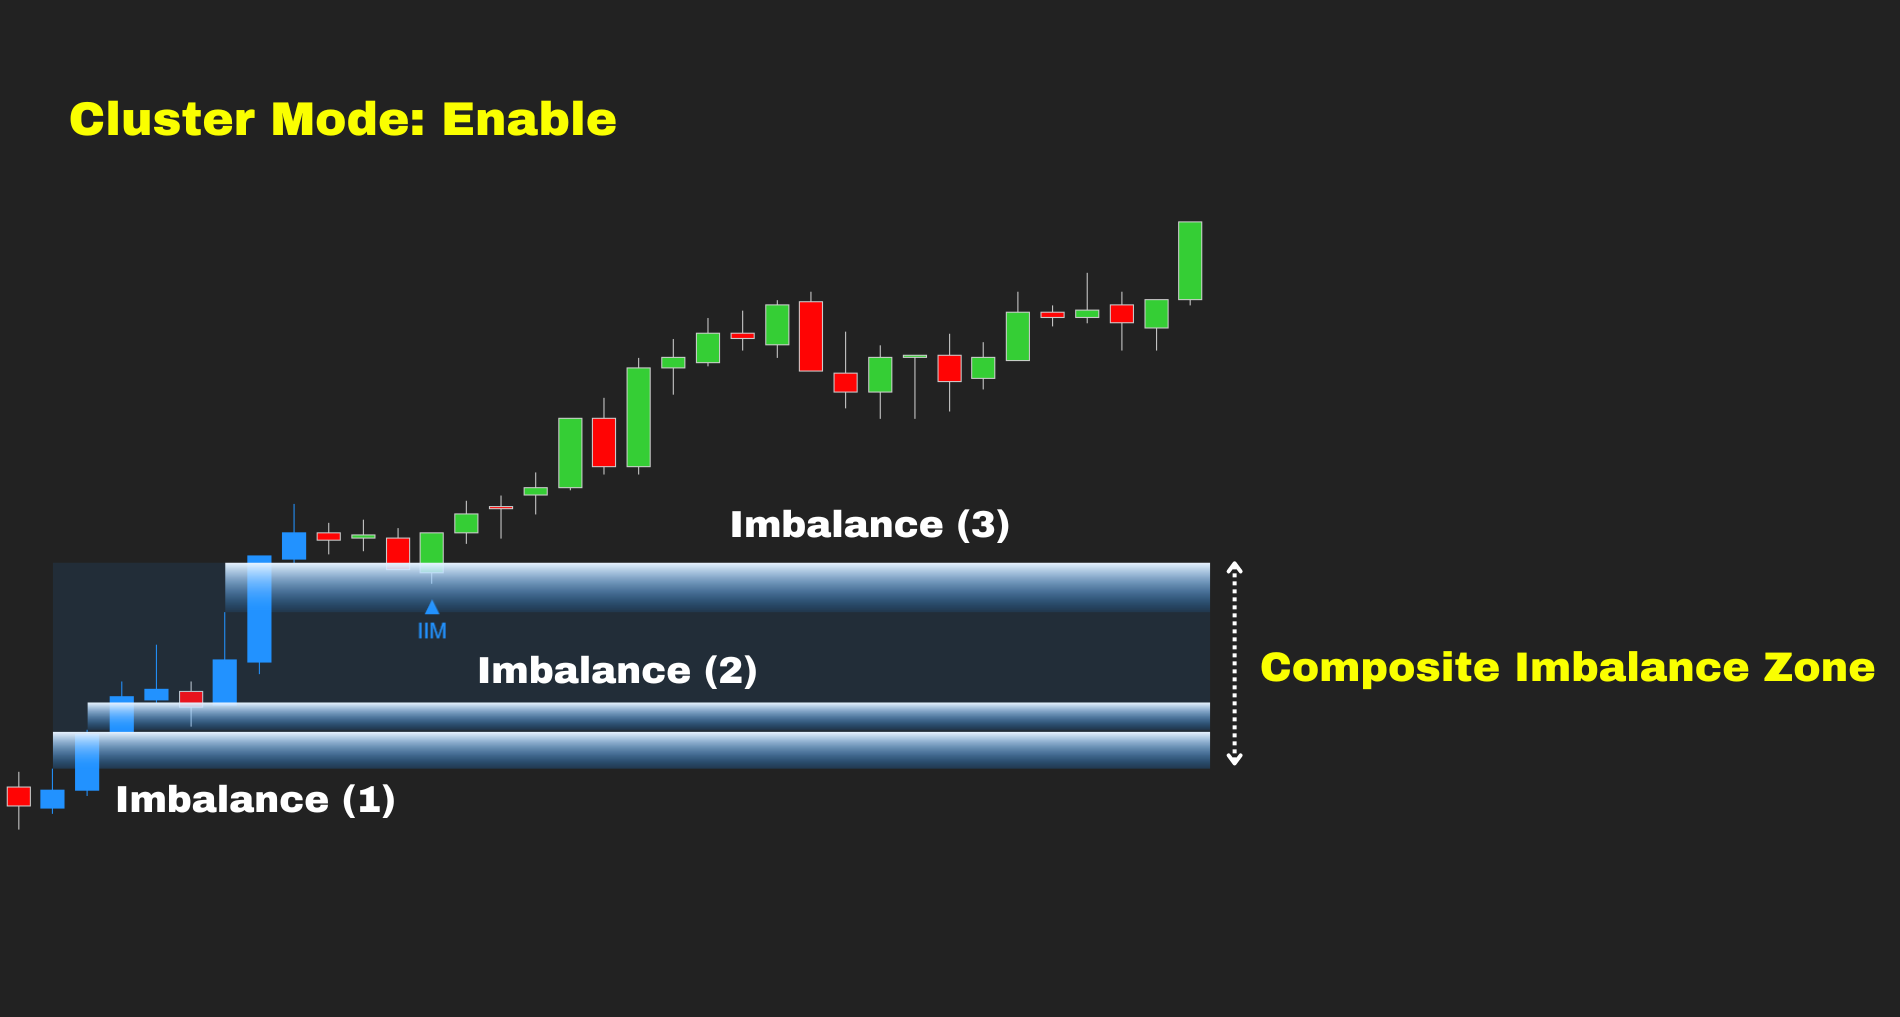
99% of traders overlook this: Imbalance is not about isolated zones
A single imbalance doesn’t always mean much.
It can be:
- A short reaction
- A random push
- Or a move with no follow-through
Looking at them individually often leads to noise.
But when imbalance starts repeating in the same area and direction, it tells a different story.
Price is being pushed again and again, and the market is clearly reacting to that level.
That’s where things become more meaningful.
Cluster: Turning repeated imbalance into a tradable zone
Instead of leaving multiple overlapping zones, Imbalance Insight Matrix groups them into a single cluster.
So instead of several small areas, you’re looking at one zone that reflects repeated pressure.
Why cluster matters
This isn’t just about making the chart cleaner.
- You remove weaker, isolated zones
- You focus on areas where price has reacted multiple times
- You get a clearer view of where pressure is building
Clusters can also help you read direction.
- If clusters keep forming in one direction, that side is likely in control
- Price is moving with intent, not just reacting randomly
You’re not trying to predict the trend – you’re reading it from how price behaves.

How Imbalance Insight Matrix differs from our other imbalance indicators
| Imbalance Profile Lidar | Uses imbalance to help map out broader price structure → Imbalance is used as context, not as the entry itself. |
| Imbalance Volume Sensor | Uses order flow to detect where one side is missing → It shows where true imbalance exists at a very detailed level. |
| Imbalance Insight Matrix | Doesn’t rely on order flow or use imbalance indirectly → It treats imbalance (based on a 3-candle structure) as the trading zone itself. |

![[AbsP] MEO #13: QuantZone + BigTrade Sweep](https://zonixtrading.com/wp-content/uploads/bigtrade-sweep-rhfbsdfvasdasd-300x300.png?crop=1)