Description
Noble POC Band – See where the market actually accepts price
For the 1st time, you are not just watching price move – you are seeing where the market truly agrees on value.
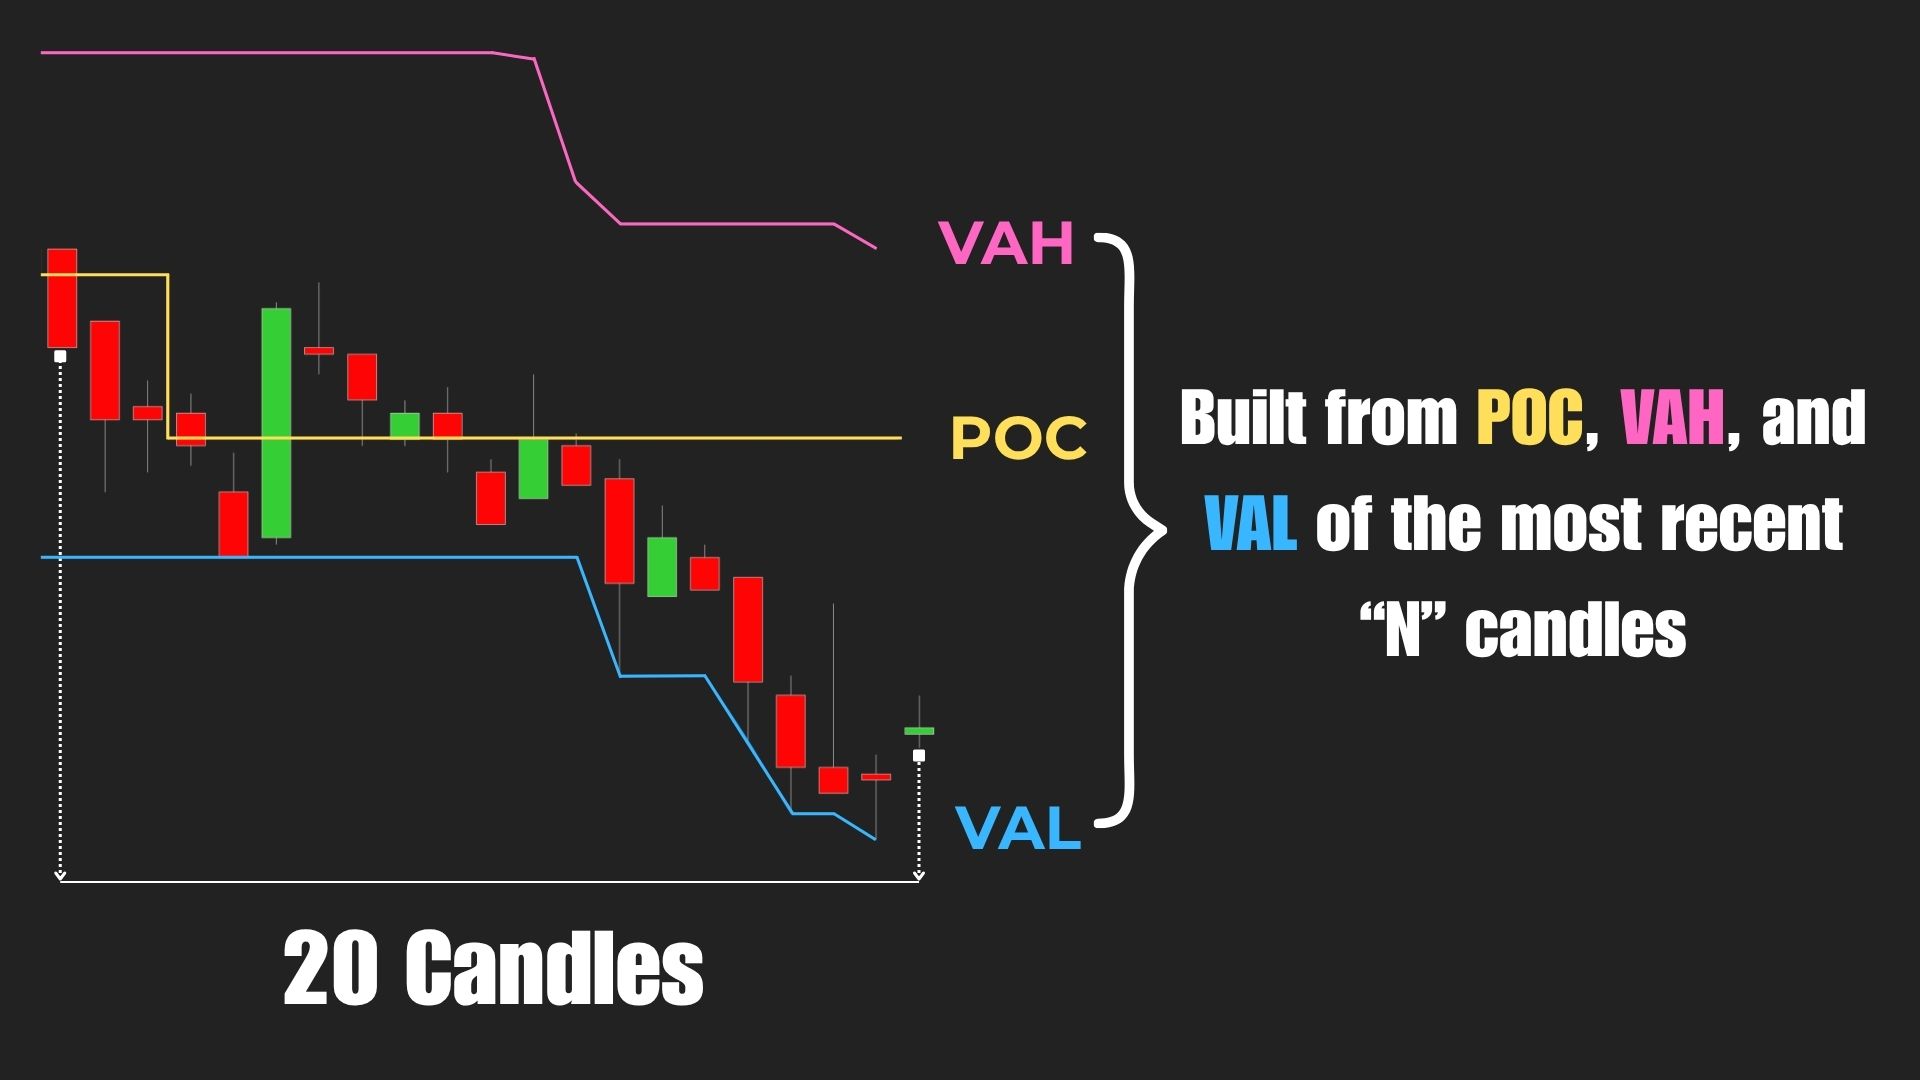
Noble POC Band is built directly from POC, VAH, and VAL of the most recent N candles, and it continuously adapts to stay aligned with current price action.
Instead of lagging behind like traditional indicators, it moves with the market, showing you exactly where trading activity is concentrated – and more importantly, where price is being accepted or rejected.
At its core, the structure is simple, but highly practical in live trading:
- The Middle Band represents the Point of Control (POC) – the price where the most volume has been traded, acting as the market’s true balance point.
- The Upper Band is the Value Area High (VAH) – the upper boundary of value, where price starts to become expensive and less accepted.
- The Lower Band is the Value Area Low (VAL) – the lower boundary of the value zone, where price becomes cheap and buyers begin to step in.
Because all 3 levels are calculated from the most recent N candles, the band is always reflecting the current market context, not outdated conditions.
What makes Noble POC Band different
If you are familiar with Bollinger Bands, the easiest way to understand Noble POC Band is to recognize that they are built on completely different foundations.
Bollinger Bands are designed to measure volatility – how far price stretches away from its average. While useful, they are still based purely on price.
Noble POC Band, on the other hand, is built on volume and value distribution. It answers a much deeper question:
“Where is the market actually trading and accepting value?”
To make this clearer:
| Component | Meaning | What it tells you |
|---|---|---|
| POC | Highest traded volume | True balance of the market |
| VAH | Upper value boundary | Where price becomes expensive |
| VAL | Lower value boundary | Where price becomes cheap |
How Noble POC Band generates trading signals
What makes this indicator especially valuable is not just its visualization, but how clearly it translates market behavior into actionable signals.
1. Break Signal – When the market accepts a new price
A true breakout is not just price moving outside a band – it is price being accepted outside of value.
With Noble POC Band, you will typically see:
- Price pushes through the POC

- Breaks beyond VAH or VAL → Stays outside the band without returning
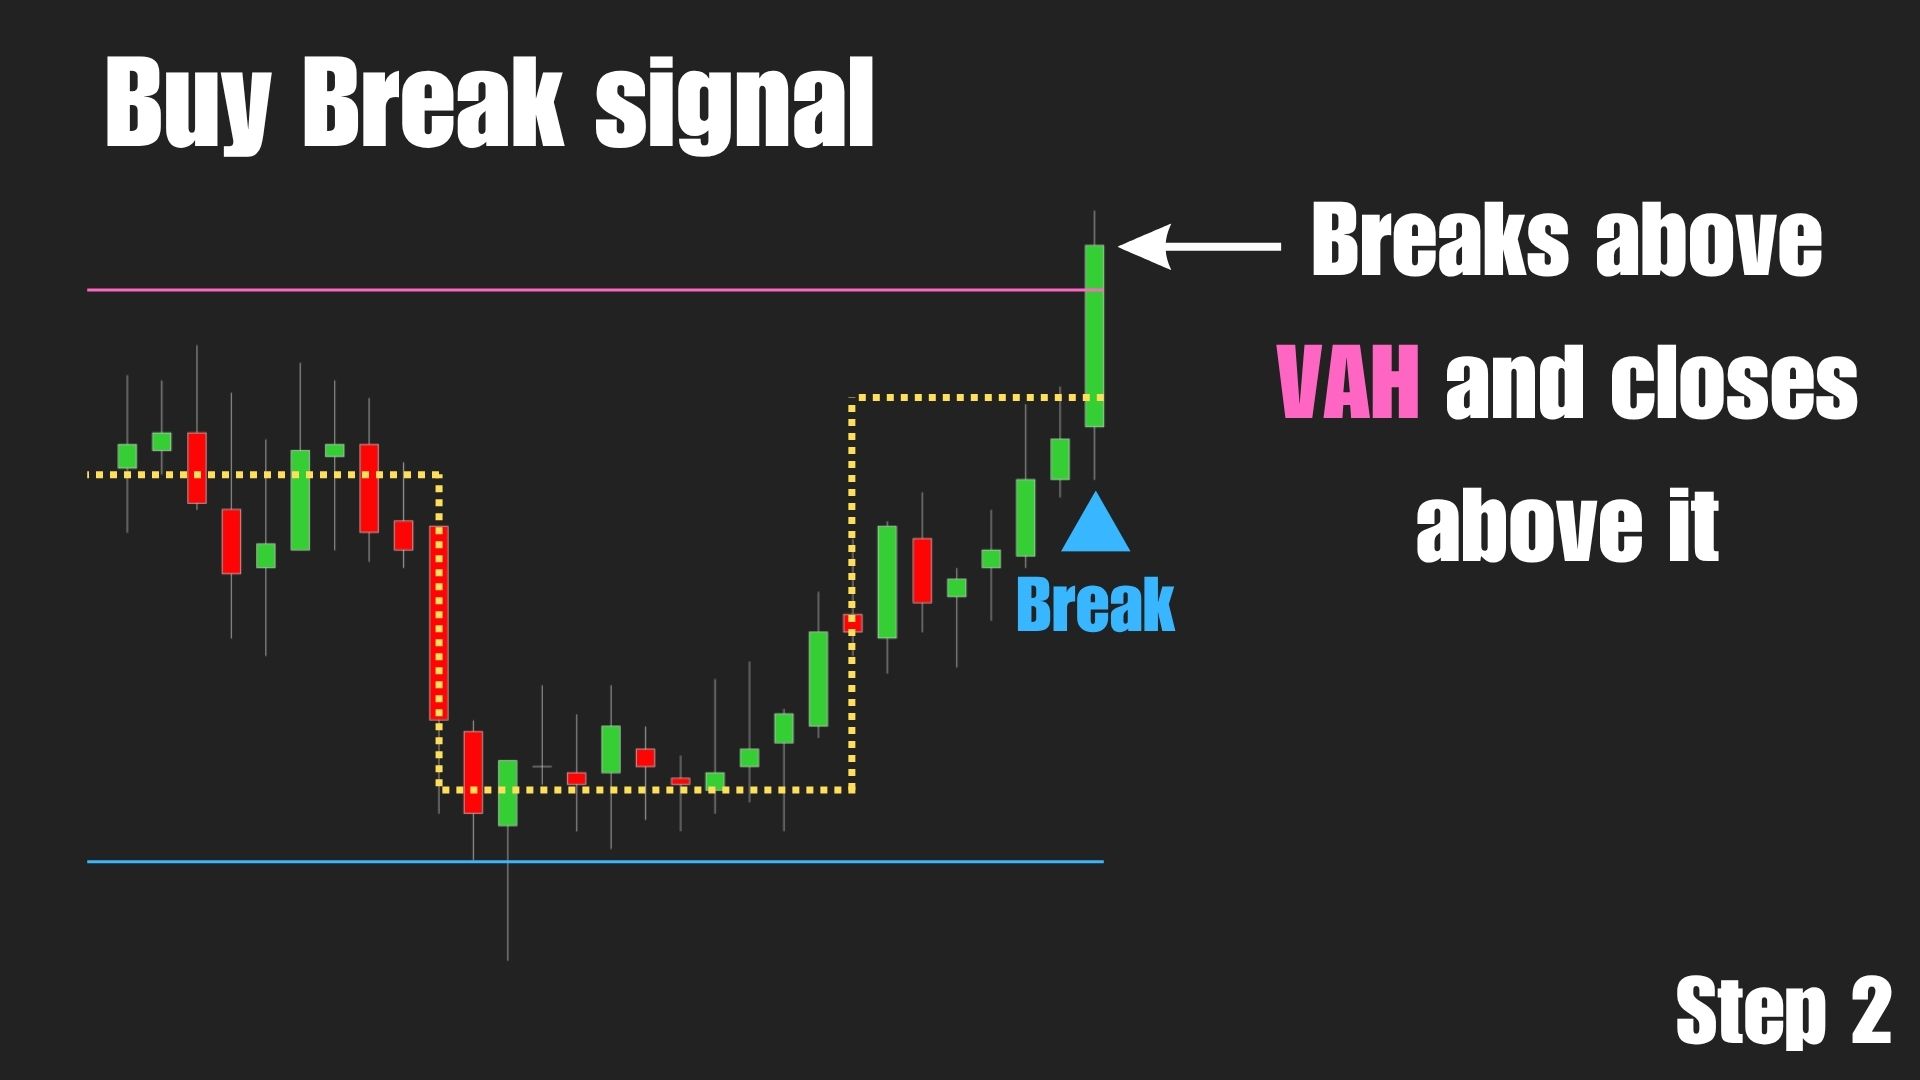
This tells you the market is no longer comfortable with the previous value zone. Instead, it is establishing a new area of acceptance. That is when a Break signal appears.
2. Return Signal – When the market rejects the move
Not all breakouts succeed, and this is where many traders get trapped. Noble POC Band helps you identify these failed moves with clarity.
In a failed breakout scenario, price may move beyond the POC and even reach VAH or VAL, but it cannot hold outside the band. Instead, it quickly returns back into the value area.
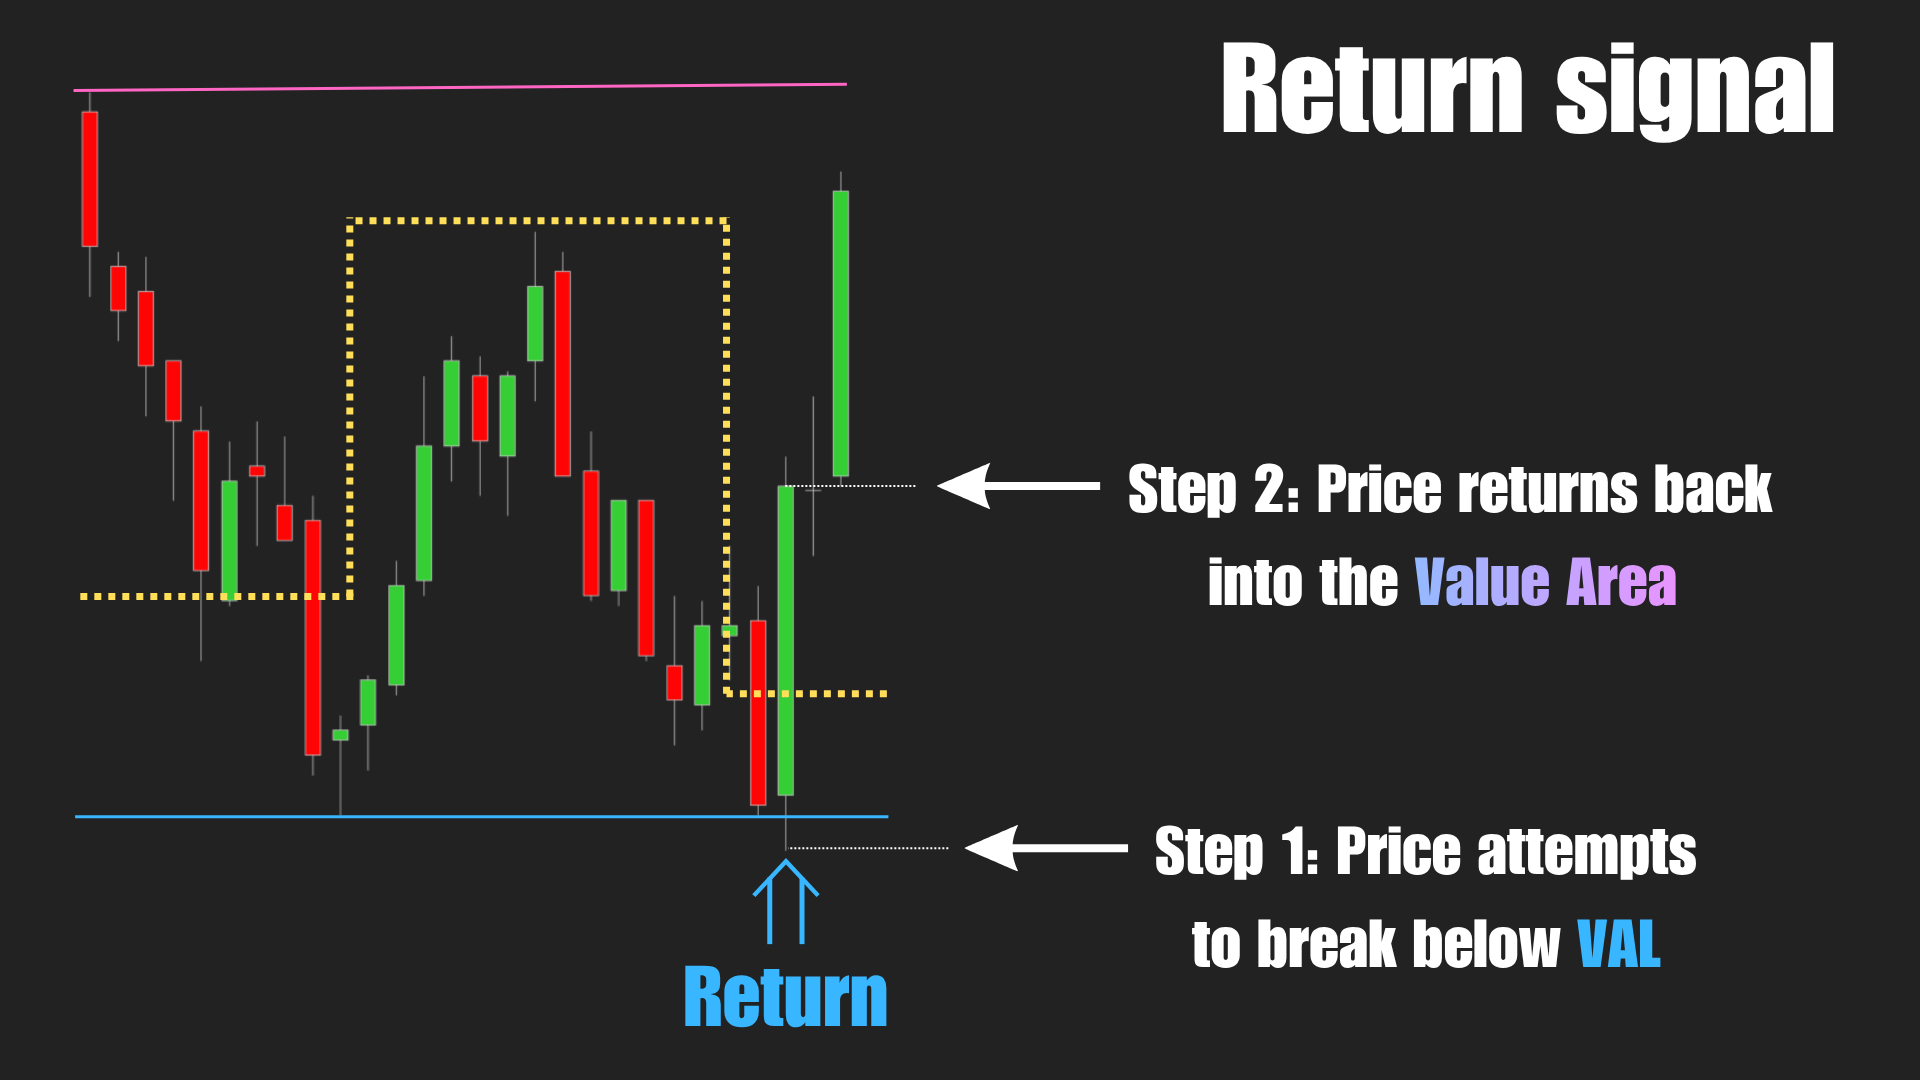
This behavior reveals that liquidity has been absorbed, and the market is rejecting those higher or lower prices. When that happens, a Return signal is generated.
The real advantage
Instead of relying on mathematical formulas derived only from price, Noble POC Band is built on actual trading behavior: volume and value distribution
This gives you a completely different perspective. You are no longer guessing based on price expansion or contraction. You are seeing:
- Where market is truly balanced
- Where it is willing to move away from value
- Where it rejects price and returns back
So, Noble POC Band helps you focus on what really matters: not just where price goes, but where the market actually cares.
And once you start seeing that clearly, your decisions become much more aligned with how the market truly works.