![[AbsP] MEO #2: Imbalance Insight Matrix + Imbalance Profile Lidar](https://zonixtrading.com/wp-content/uploads/ImbalanceInsightMatrix-_ImbalanceProfileLidar.png)
Description
Identify High-Probability Trade Locations In Minutes Using a Dual-Layer Imbalance + Volume Framework
Read validated imbalance, align it with real volume concentration, and execute with structure – typically within a single chart session.
- Imbalance Insight Matrix defines where movement is real.
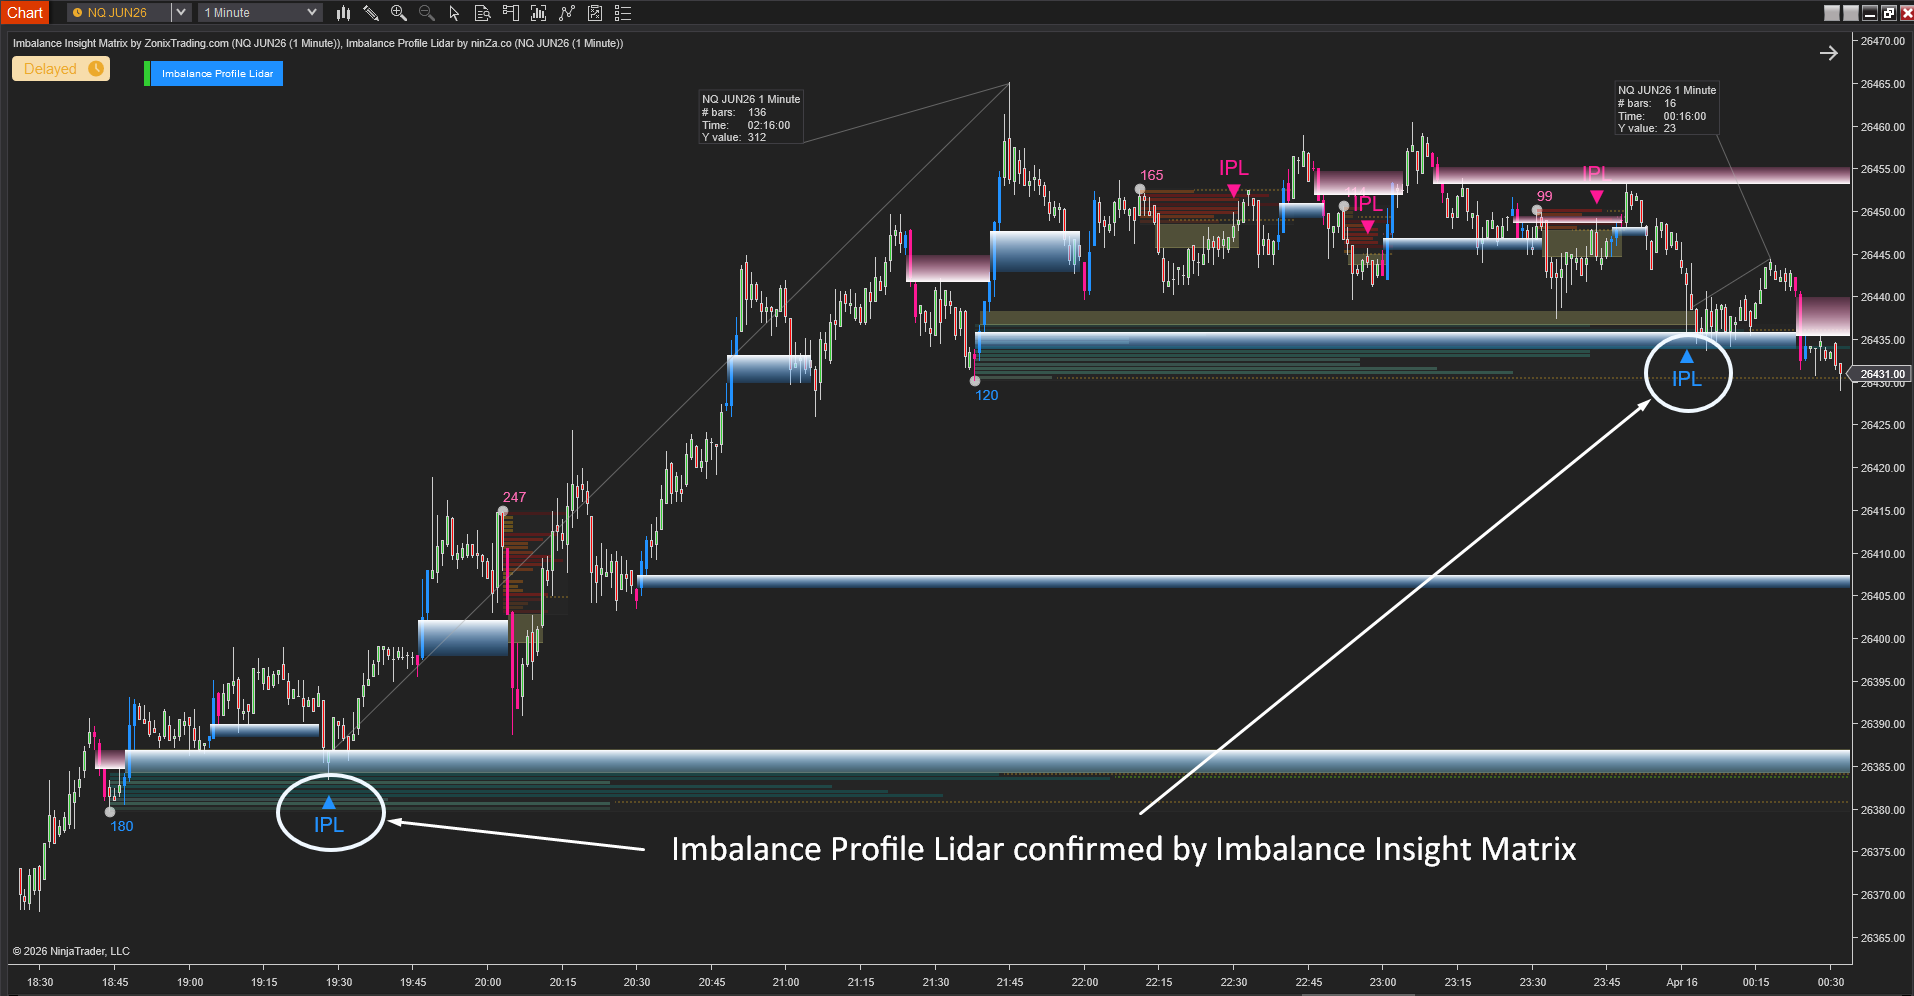
- Imbalance Profile Lidar shows where the price is likely to react.
The Real Problem
You’re frustrated because:
- You draw support and resistance, but the price doesn’t respect it
- You see imbalance zones everywhere, but don’t know which ones matter
- Volume looks useful, but doesn’t translate into clear entries
- You enter “good setups” and still get stopped out
- Your chart has signals, but no clear decision point
The issue is not your strategy.
👉 You’re missing alignment between imbalance (structure) and liquidity (volume)
Without that:
- Zones become subjective
- Entries become inconsistent
- Risk becomes reactive instead of planned
What This Combo Actually Does
A structured way to read price: imbalance + liquidity alignment
Step 1 – filter imbalance (structure)
What it does
Imbalance Insight Matrix filters all imbalance zones using a strict 3-layer model:
- Dominant candle (structural strength)
- Required continuation (real displacement)
- No immediate return (control holds)
Why it matters
Most imbalance is noise. Only a small portion leads to meaningful movement.
Result
You focus only on imbalance that already shows:
- Intent
- Continuation
- Control
Step 2 – map volume (liquidity)
What it does
Imbalance Profile Lidar automatically identifies:
- Value areas
- POC (point of control)
- Volume concentration zones
- Imbalance behavior inside those zones
Why it matters
Volume shows where the market accepts price.
Result
You know where price is likely to:
- Return
- React
- Continue
Step 3 – execute with confluence
What it does
You combine:
- Imbalance clusters (structure)
- Value area / POC (liquidity)
Why it matters
Execution improves when both structure and liquidity align.
Result
- Clear entry locations
- Logical stop placement
- More consistent risk-to-reward

Product Highlights
Imbalance Insight Matrix (structure layer)
- Filters imbalance using a 3-condition validation
- Removes weak and invalid zones automatically
- Groups repeated imbalance into clusters
- Reveals directional pressure through price behavior
Role: defines where price movement is meaningful

Imbalance Profile Lidar (execution layer)
- Automatically detects volume profile zones
- Identifies value areas and POC
- Maps imbalance within volume zones
- Generates signals inside key liquidity areas
- Eliminates manual drawing
Role: defines where to execute with precision
Special Offer
Imbalance Insight Matrix: $600 (Value)
Imbalance Profile Lidar: $600 (Value)
1-Year Product Updates: $240 (Value)
Personalized Support: $50 (Value)


![[AbsP] MEO #4: Imbalance Insight Matrix + Gravity OrbitX](https://zonixtrading.com/wp-content/uploads/Gravity-OrbitX-Imbalance-Insight-Matrix-300x300.png?crop=1)
![[AbsP] MEO #3: Imbalance Insight Matrix + StepMA Crossover](https://zonixtrading.com/wp-content/uploads/Imbalance-Insight-Matrix-StepMA-Crossover-2-300x300.png?crop=1)
![[AbsP] MEO #2: Imbalance Insight Matrix + Imbalance Profile Lidar](https://zonixtrading.com/wp-content/uploads/ImbalanceInsightMatrix-_ImbalanceProfileLidar-300x300.png?crop=1)