Black Friday in Spring
 Description
Overview
In fast-moving markets, price often fluctuates without clear direction, making it difficult to distinguish meaningful reversals from short-term noise.
ZonixRenko addresses this by providing a cleaner way to read price – without losing the structural context behind each move.
It is built on a combination of:
- Renko logic: filtering noise through fixed price movement
- Price action: confirming reversals through structure breaks
The result is a chart that keeps trends clear and easy to follow, while ensuring reversals are backed by meaningful shifts in market structure rather than short-term price fluctuation.
Core mechanism
ZonixRenko is built around 2 core components: Reversal Threshold & Trend Step, each controlling a different aspect of price behavior.
1. Reversal Threshold – Defining Reversal
The Reversal Threshold controls when a true reversal occurs. Instead of reversing based purely on price movement, ZonixRenko requires price to break the open–close range of the previous N bars.
Under this structure:
- The last N bars define the current structural range
- A reversal bar is formed only when price breaks out of this range in the opposite direction

2. Trend Step – Defining Continuation
The Trend Step determines how price movement is translated into continuation bars. A new bar is formed when price moves from open to close by at least the defined threshold (measured in ticks).
As long as price meets this requirement, additional bars are printed in the same direction.

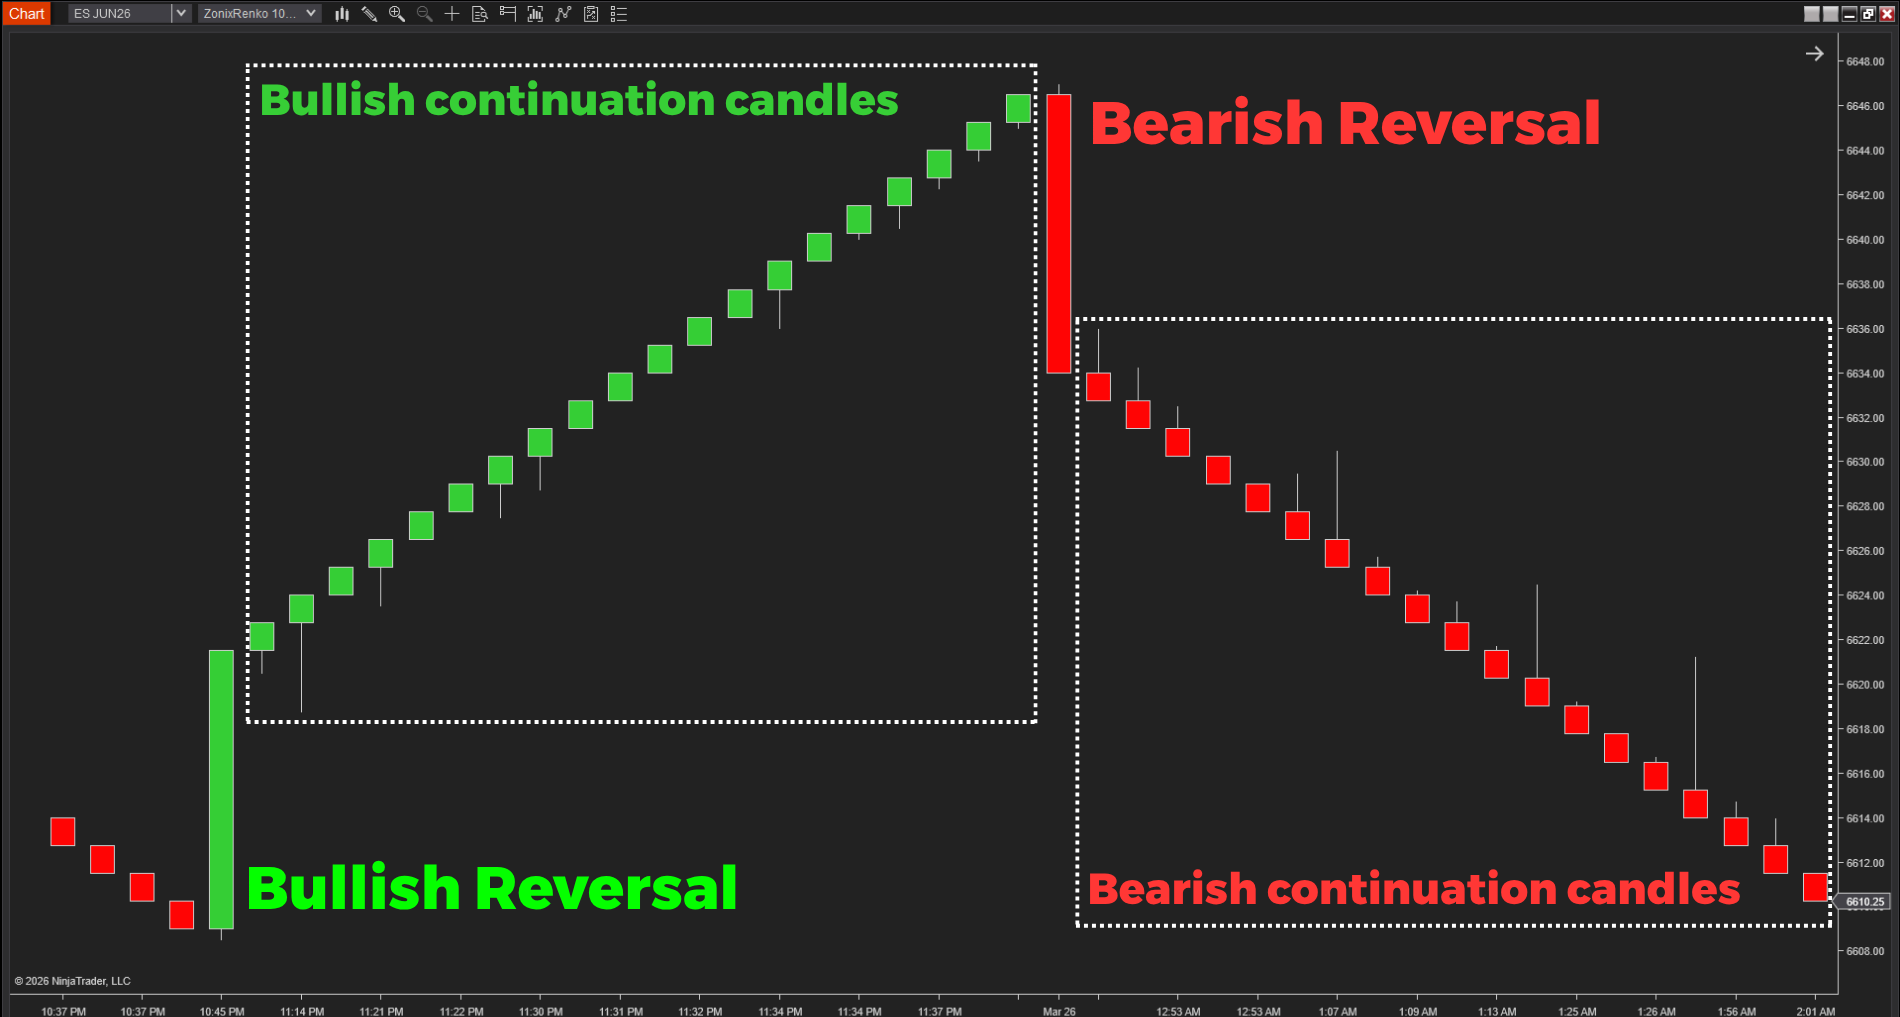
Why ZonixRenko Reversals are more stable
When price breaks the body range of the last N bars, a reversal signal can appear quickly. This allows traders to recognize the shift early and participate closer to the start of the move.
This behavior is particularly useful for short-term trading. Strategies such as scalping or fast intraday trading benefit from earlier entries, where reacting quickly to market changes can make a meaningful difference.
In fast-moving markets, breaking the body range of recent bars also helps identify reversals sooner and with greater clarity. Instead of waiting for large counter-moves, the chart highlights structural shifts as they begin to form.


![[AbsP] MEO #4: Imbalance Insight Matrix + Gravity OrbitX](https://zonixtrading.com/wp-content/uploads/Gravity-OrbitX-Imbalance-Insight-Matrix-300x300.png?crop=1)
![[AbsP] MEO #3: Imbalance Insight Matrix + StepMA Crossover](https://zonixtrading.com/wp-content/uploads/Imbalance-Insight-Matrix-StepMA-Crossover-2-300x300.png?crop=1)
![[AbsP] MEO #2: Imbalance Insight Matrix + Imbalance Profile Lidar](https://zonixtrading.com/wp-content/uploads/ImbalanceInsightMatrix-_ImbalanceProfileLidar-300x300.png?crop=1)