Description
Overview
ZonixVector is built on the same foundation as Renko, removing time and focusing purely on price movement. The difference lies in how reversals are defined.
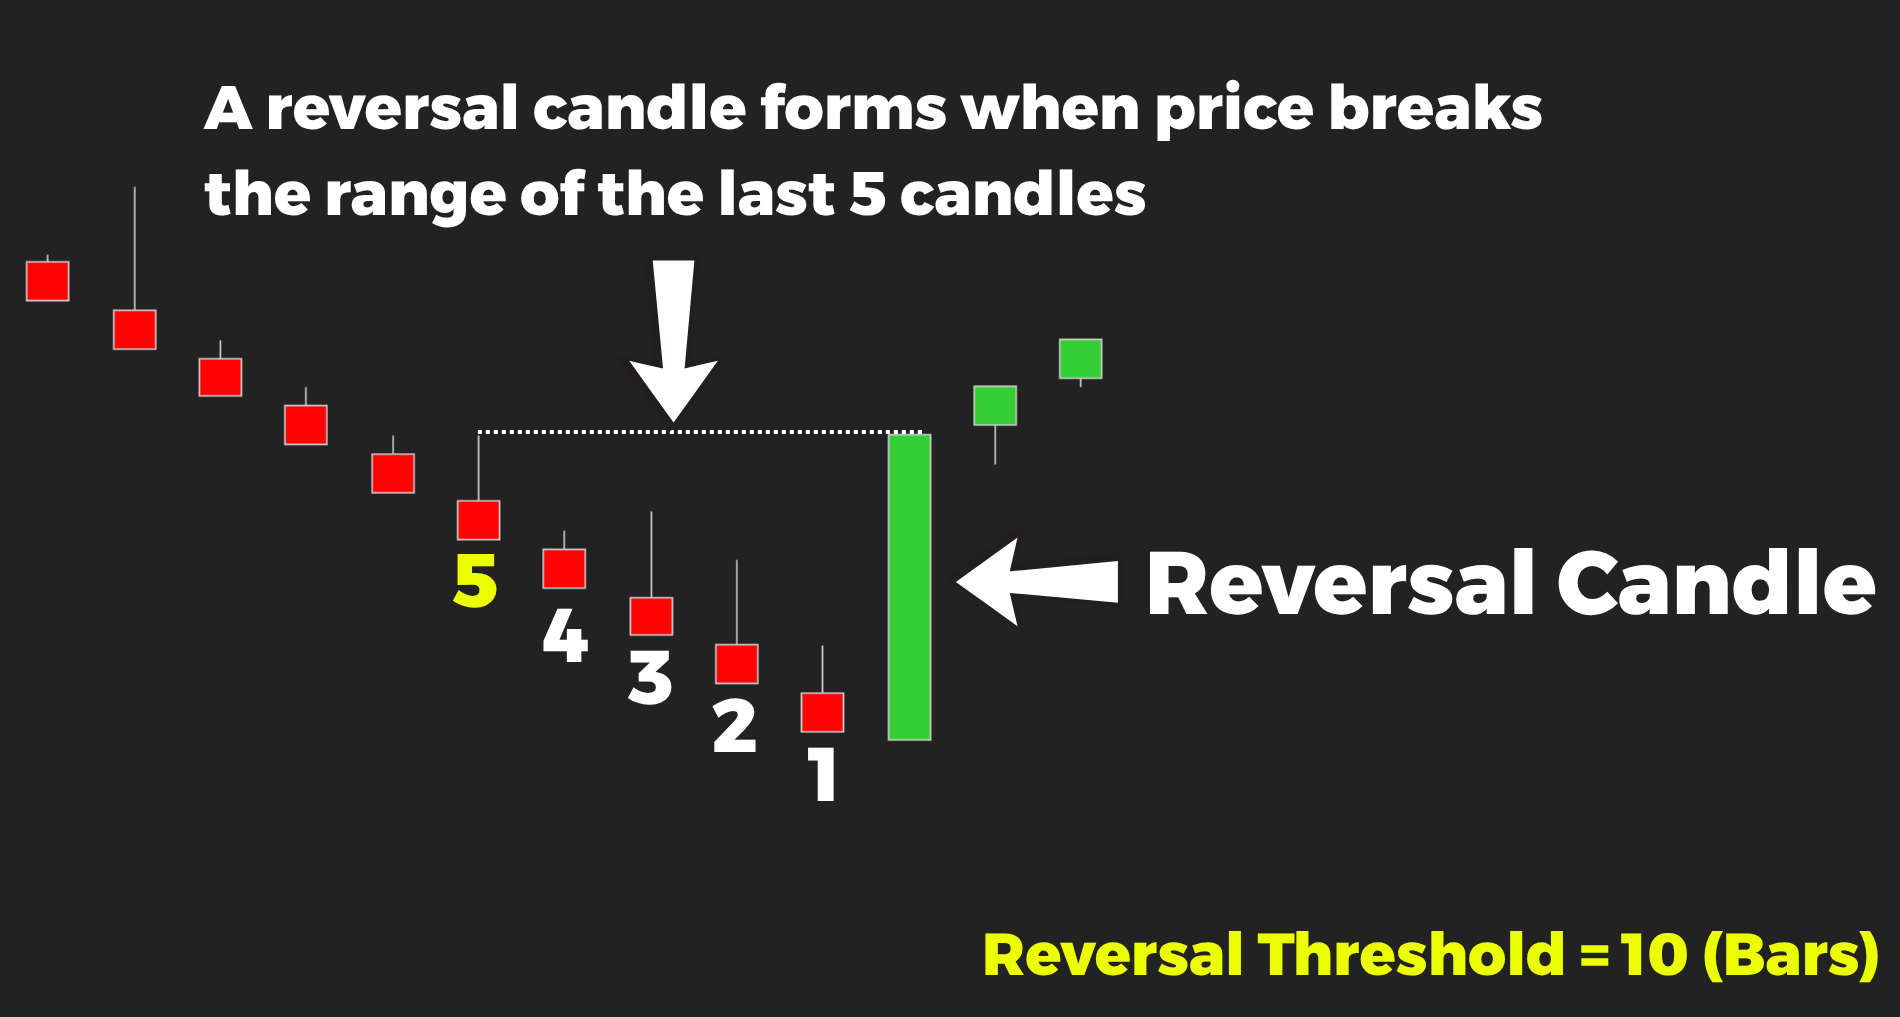
A reversal in ZonixVector is not triggered by a simple move in the opposite direction. It only forms when price breaks through the entire range – high to low – of previous candles.
Instead of reacting to movement, ZonixVector requires the market to prove a real structural shift before printing a reversal.

How ZonixVector works
ZonixVector is built around 2 core components:
1. Reversal Threshold
This defines how many previous candles are used as a reference.
A candle is only considered a reversal when: Price breaks through the entire range (high–low) of the previous (N) candles.
This means the market must move beyond all recent extremes — not just close beyond a level, but fully invalidate the prior range.
2. Trend Step
This defines the size of each continuation candle (measured in ticks).
In order to form a new candle in the same direction, price must move a fixed number of ticks (X).
This works similarly to traditional Renko, ensuring consistent movement is required to build a trend.

Why full-range Breaks lead to stronger Reversal Candles
By requiring price to break the entire range of previous candles – including wick extremes – ZonixVector filters out weaker signals and highlights moments when market structure truly shifts.
Fewer false signals
Because price must move beyond the full candle range, minor pullbacks and short-term fluctuations are less likely to trigger reversals. This helps reduce noise and prevents many of the misleading signals that appear in choppy markets.
More meaningful reversals during weakening trends
Full-range breaks often appear when momentum begins to fade or when control shifts between buyers and sellers. These moments can signal the early stages of a genuine trend reversal.
Stronger confirmation of structural change
Breaking candles that include long wicks means price has moved beyond previous rejection levels. In other words, the market has not only challenged the prior move but fully invalidated it.
Better suited for medium- to longer-term trades
By focusing on larger structural breaks rather than small fluctuations, this approach helps traders identify more significant turning points in the market. This can be especially useful in strong trending environments.


![[AbsP] MEO #6: Entropy Voltex + Quant Zone](https://zonixtrading.com/wp-content/uploads/Entropy-Voltex-QuantZone-300x300.png?crop=1)